Exploring the value of students’ midterm data
Timing is critical when it comes to student interventions. In an ideal world, an institution would be notified as soon as a student begins to veer off path, enabling them to intervene and steer the student back on course. This is why we’re always looking for ways to incorporate relevant data into our predictive model.
But when it comes to how (and if) midterm data should be used, we hear varying opinions from our SSC members. And gathering consistent and reliable midterm data involves a coordinated effort from multiple parties—it’s easier said than done. So before we recommend inclusion of this information in the risk model, our data science team set out to explore how predictive midterm grades are of final course performance.
-
Get to know our Data Science Team
SSC members benefit from an army of support: researchers, consultants, and higher education experts, to name a few. But are you familiar with the work of our Data Science Team? Learn more.
Is there a place for midterm grades in our model?
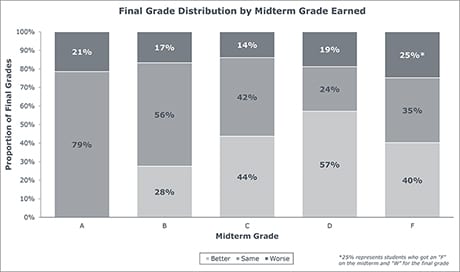
Preliminary research from a subset of 17 institutions in the SSC national data set found that midterm grades aren’t necessarily as strong an indicator of final grades as one might have guessed. But that doesn’t mean they aren’t important. Our analysis found that roughly 80% of final grades are the same or better than midterm grades—meaning many midterm grades actually underestimate final grade performance. Triggering success marker alerts on midterm grades could be problematic if 80% of final grades are the same or better. Midterm triggers could result in false alarms. For example, most marker thresholds are Cs and 44% of C midterm grades result in either A or B final grades.
However, we should not dismiss the value of midterm grades altogether. Sixty percent of midterm Fs result in no credit at all (i.e. an F or W grade), and only 14% of D and F midterm grades result in a final grade above a C, a performance level that typically suggests higher desired proficiency in course material. Clearly students with low midterm grades are not mastering the material, and the “same or better” trend isn’t necessarily strong enough to push up midterm Ds and Fs.
So what, if any, student intervention should be taken based on midterm data?
Still much to be learned
These are just a few preliminary findings from our research on midterm data, and we have a lot more research to do. Just as we’ve explored grade trending within our Murky Middle research, we’re also interested in midterm grade trends and the associated research questions, such as:
- Even if a majority of midterm D grades result in credit, what is the downstream implication or likelihood of failure in the next sequential course?
- Does a final C grade mean anything different for a student who had a B midterm grade than for a student who had a D midterm grade?
More Blogs

What matters to student success teams in 2026

Four signs it’s time to break up with your student CRM

