Infographic
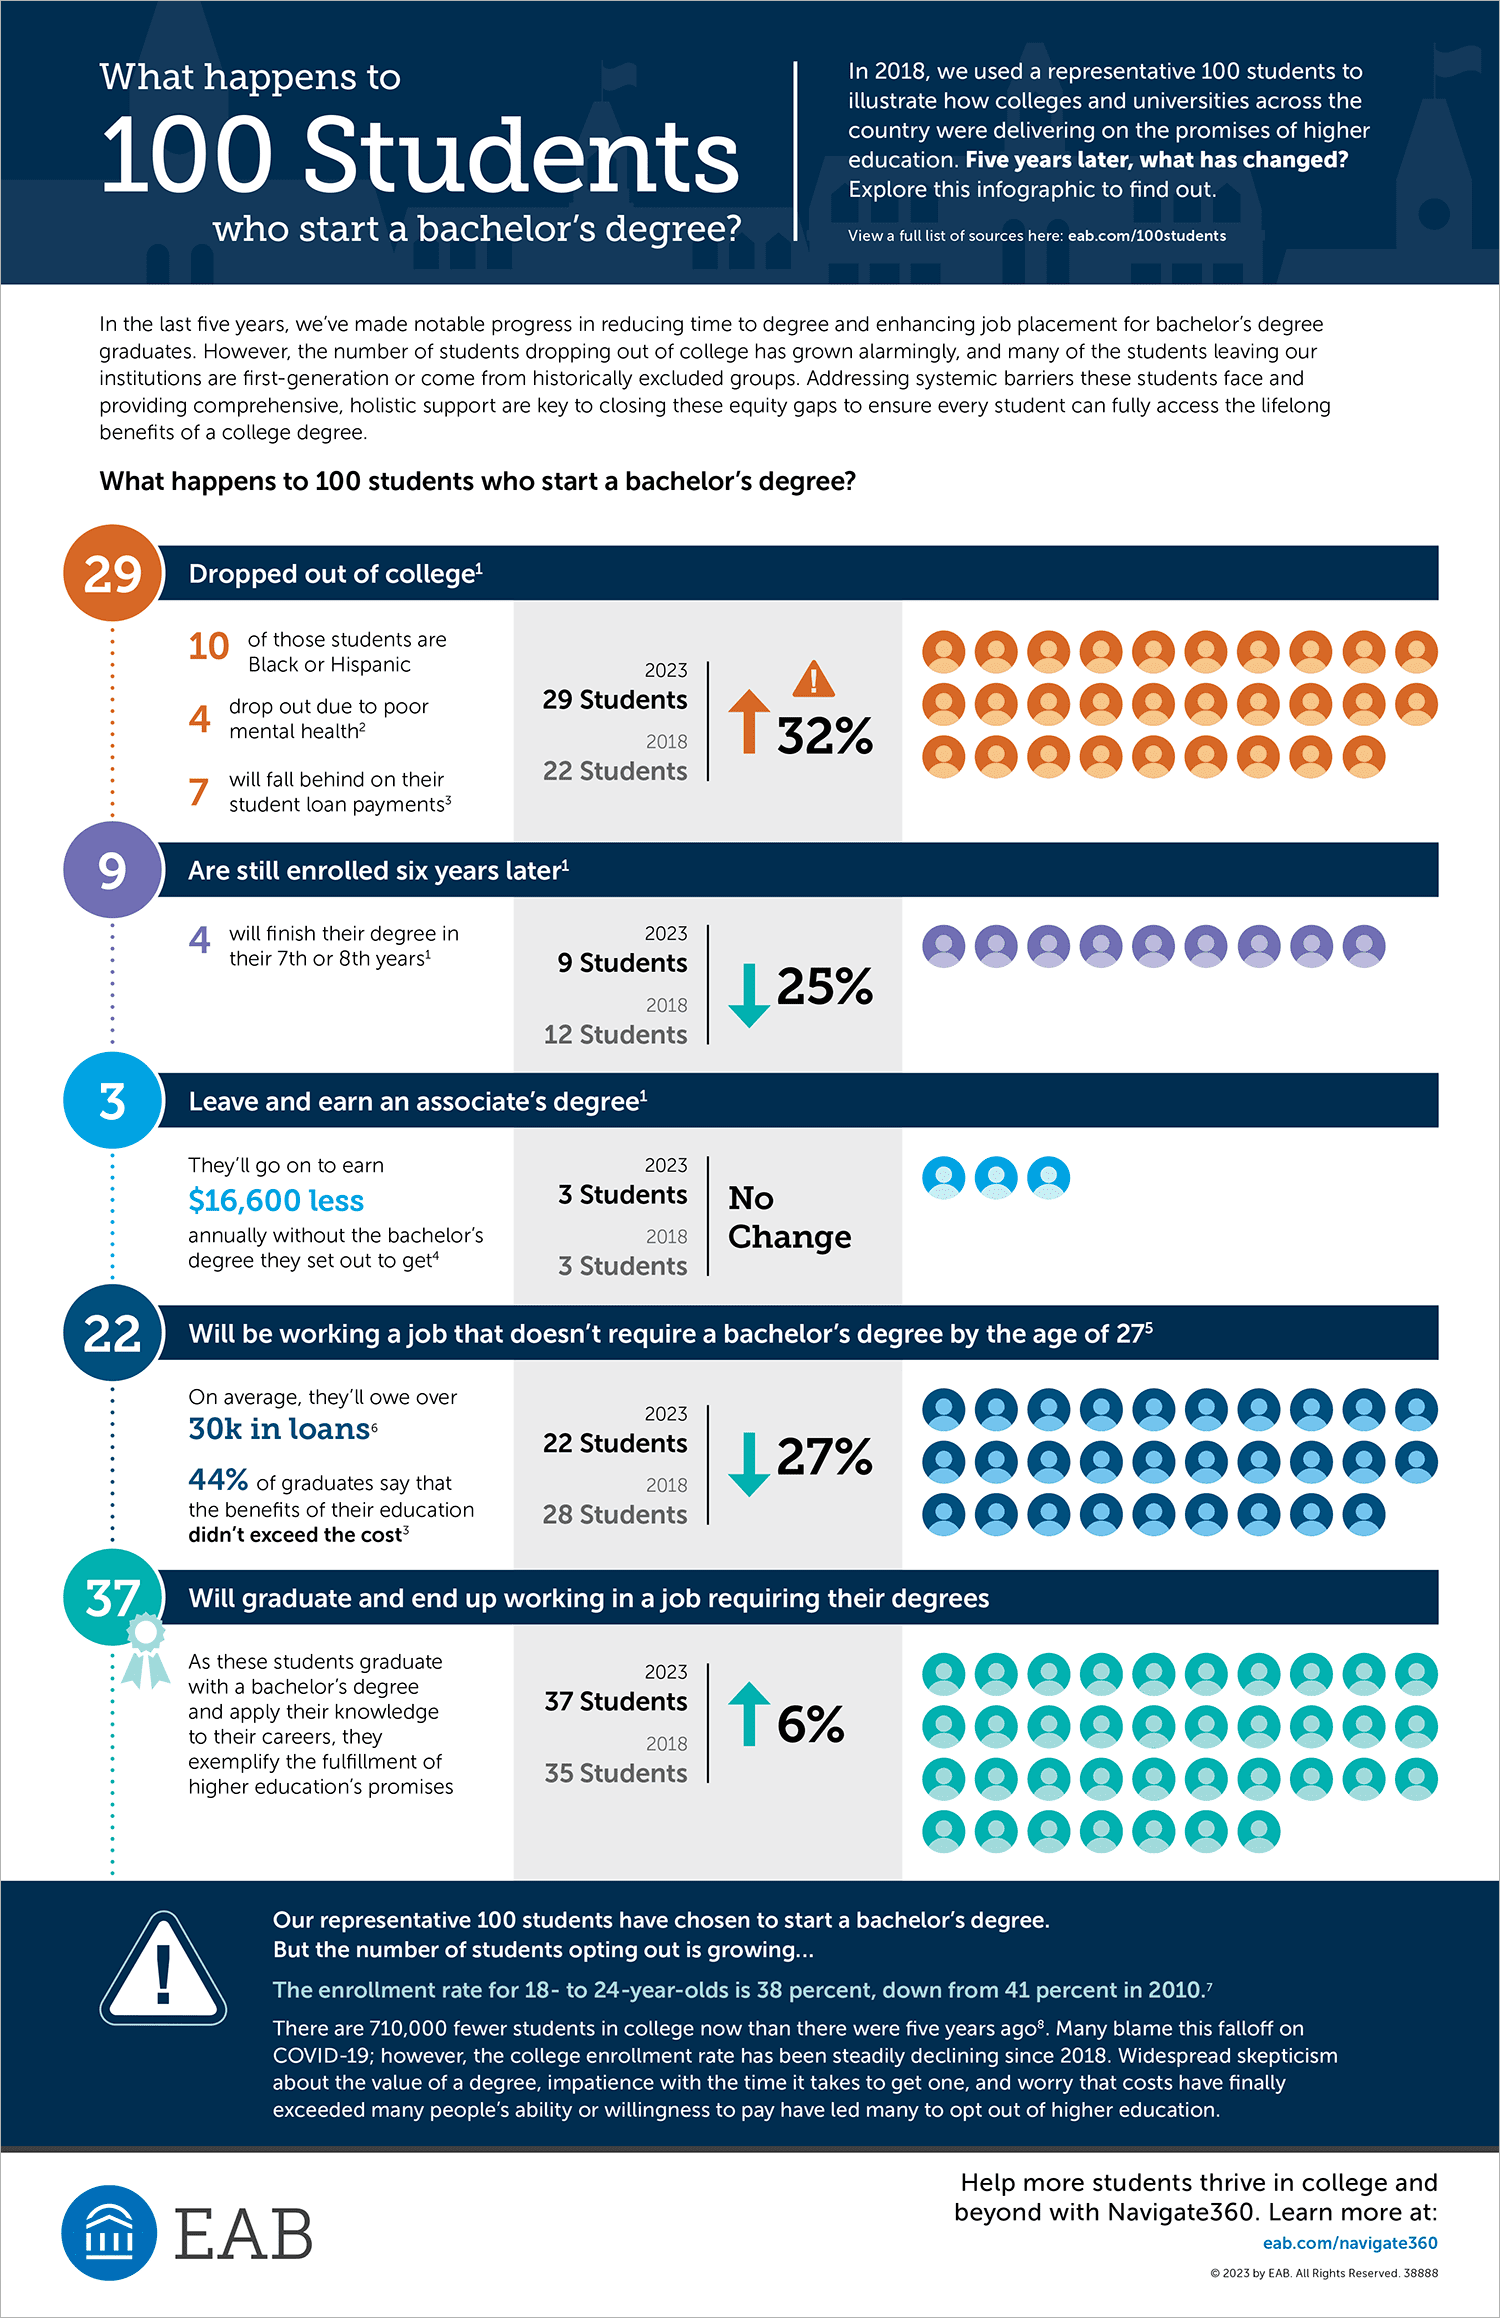
What happens to 100 students who start a bachelor’s degree?
In 2018, we used a representative 100 students to illustrate how colleges and universities across the country were delivering on the promises of higher education. Five years later, what has changed? Explore this infographic to find out.
View a full list of sources below.
Sources
- “Completing College: Completing College National and State Reports – Fall 2016 Cohort” National Student Clearinghouse Research Center (2022).
- “How America Completes College: Understanding What Helps Students Graduate” Sallie Mae, in partnership with Ipsos (2022).
- “Economic Well-Being of U.S. Households in 2021” Board Of Governors Of The Federal Reserve System (2022).
- “Annual Earnings by Educational Attainment“ U.S. Department of Education, Institute of Education Sciences (2022).
- Federal Reserve Bank of New York, The Labor Market for Recent College Graduates
- Hanson, Melanie. “Average Student Loan Debt” EducationData.org, May 22, 2023
- “Immediate College Enrollment Rate: Condition of Education” U.S. Department of Education, Institute of Education Sciences.
- “Digest of Education Statistics 2022 – table 303.10.” NCES (2022)
More Resources

Video
Presidents on Navigate360: Building a Sustainable Student Success Culture
In this panel discussion, three presidents share how EAB’s Navigate360 is helping their institutions respond to today’s student…
Navigate360

Video
The CRM Implementation That Changed the Way University of Utah Approaches Student Success
Learn how the University of Utah aligned decentralized student success teams to create a unified, student-first support network…
Navigate360
Infographic
Four Possible Futures for College Graduates in the AI Workforce
Explore four future scenarios for entry-level jobs shaped by AI and how institutions can prepare graduates for a…
Navigate360