Administrative and academic leaders alike want to make better decisions based on high quality, actionable data. But while many institutions are making significant technology investments to improve data quality these investments are useless without staff who can access and analyze this data and communicate trends to leaders.
Related infographic
This is leading to the emergence of a new role: the business intelligence (BI) analyst. These staff possess different skill sets from the programmers hired in decades past: BI analysts are less focused on technical data manipulation and more focused on data analysis and communication.

Of course, colleges and universities aren’t the only organizations turning to business intelligence staff to expand their analytical capabilities. These roles are in high demand across sectors, and they are accordingly commanding high salaries. As a result, most institutions can’t afford to hire new BI analysts for every unit. Instead, finance and IT leaders are looking to build central BI teams at scale.
Identify and scale existing analytical capabilities across campus
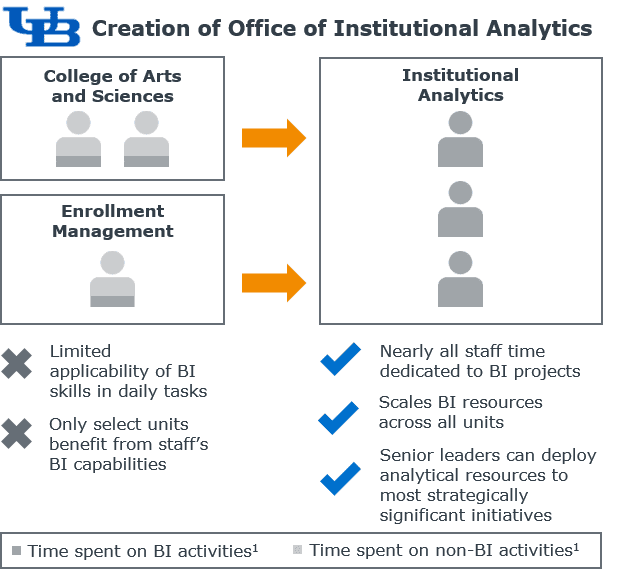
One strategy to create campus-wide BI capabilities is to identify existing staff with BI skills and centralize them in a shared office. The University at Buffalo took this approach to create a central Office of Institutional Analytics. Senior leaders wanted to expand data analytics in academic affairs. Through planning conversations, they identified two academic administrators with sophisticated data skills, plus an Enrollment Management staff member spending a small portion of his time on BI. They hired these staff into new roles and formed a central BI team.

Prior to the BI team formation, these staff members spent a fraction of their time on analytics projects that primarily benefited their home offices. Now, BI staff spend the majority of their time on analytics, and leaders can deploy their in-demand skill sets to the highest priority projects.
Buffalo is already seeing results from the central BI team. Highlights include:
- Data visualizations and dashboards: The BI team has created 20+ dashboards for financial decision-makers, spanning space, HR, student, and financial metrics. It also produces data visualizations in Tableau (e.g., student enrollment by program) to enhance decision support. Review their publicly available dashboards here.
- BI as a data hub: Staff across campus can now access the BI team’s existing dashboards for their data needs, rather than spending time generating (and duplicating) these reports individually. Today, nearly all analytics requests flow to the central BI team.
- Improved data culture: Because stakeholders across campus have grown to trust the BI team’s centralized data and reporting, units are no longer possessive about their data. Instead, leaders discuss how to use these tools to inform their strategy and decisions. Staff have moved beyond only reporting metrics; they also evaluate trends and create future projections.
- Silo-busting: The Offices of Institutional Analytics, Enrollment Management, and Resource Planning rely on a uniform set of data and dashboards produced by the BI team. This coordination has led to more productive conversations and strategy on enrollment and tuition revenue.
10 “no-regrets” analyses to start your BI initiative
Once you have BI staff in place, the next likely question is where they should begin. There are hundreds of potential reports they can develop and analyses they can run. Consult EAB’s Ten No-Regrets Analyses to kickstart your BI initiative. This infographic outlines ten foundational academic data analyses that isolate key academic cost drivers and savings opportunities, such as measuring faculty workload and collapsing excess sections. Have your BI team start with these analyses, if you aren’t running them already.