Build Financial Dashboards to Communicate with Boards and Other Stakeholders
Higher education’s budgetary climate has heightened board and other stakeholders’ (for example, academic leaders, alumni, and parents) interest in their institutions’ financial health. In response, finance leaders are looking to build board-facing financial dashboards to meet rising stakeholder demands for additional financial information.

Select key performance metrics to display
The first step to building an effective financial dashboard is choosing which performance metrics to monitor and display. Most finance leaders share a similar set of revenue and cost metrics and financial indicator ratios. Use the link below to review the most commonly used metrics and ratios so you can avoid recreating the wheel.
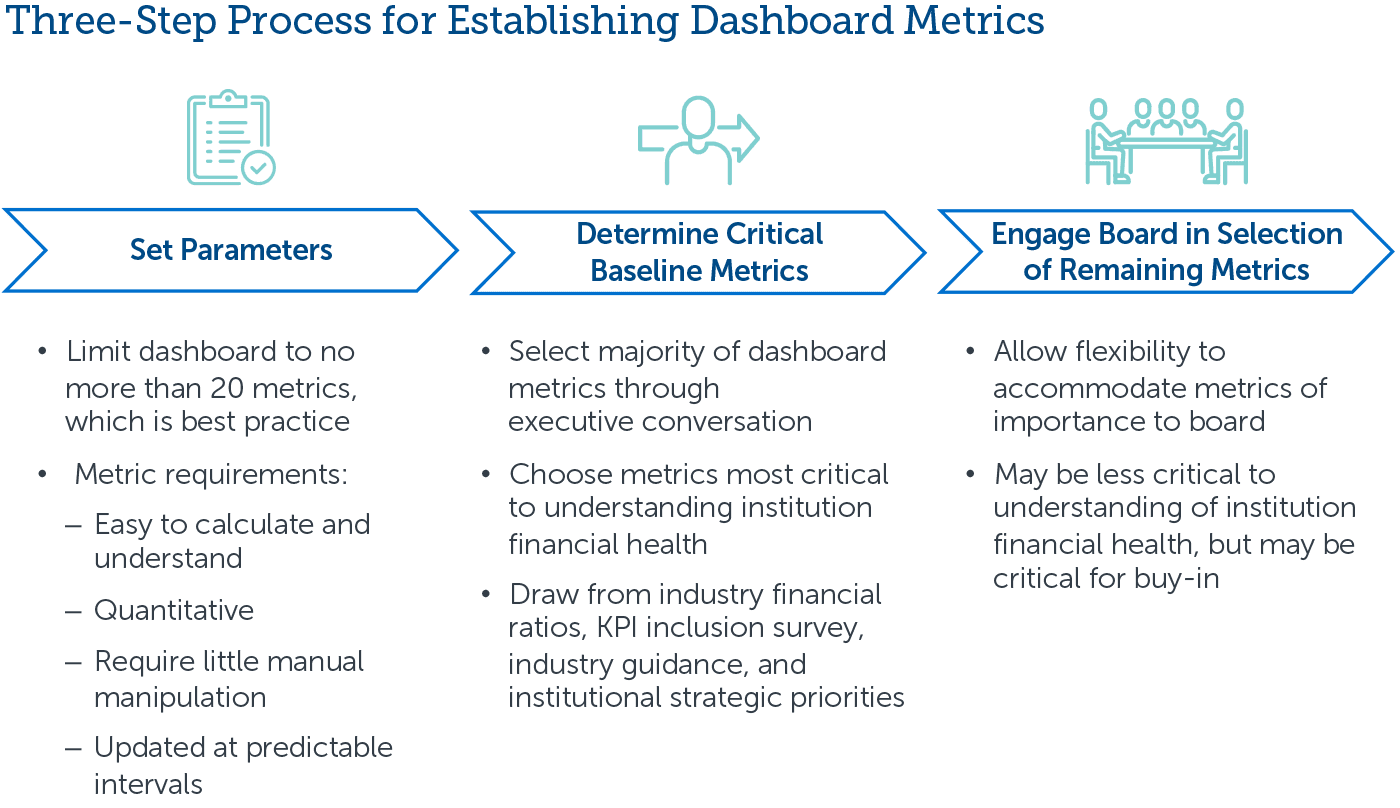
Finance leaders should then follow the three-step filtering process illustrated in the graphic below to select specific metrics to share on their institutional dashboard. Drawing on both private sector and higher education best practices, this process ensures metrics reflect both industry norms and institution-specific priorities.


Visualize and display metrics
While elevating the right metrics is critical, poor design can make or break efforts to better leverage data. Leaders should consider the three tips illustrated in the graphic below to design dashboards to increase the utility of their board-facing dashboards.
Finance leaders should also display KPIs alongside historical and peer data—reference points which allow users to contextualize and make effective judgments about trends. This is particularly important at colleges and universities, where board members might not have the background in higher education finance to fully understand the significance of some KPIs on their own.

Three Tips for Designing Board-Facing Dashboards
-
Be concise
- Limiting static dashboards to three pages or less enhances likelihood that board member will engage with content
- Private sector standard dashboard length is 1-3 pages
-
Use data visualizations
- Adding data visualizations simplifies complex KPIs and allows more data to be shared in less space
- Most effective private sector data visualization elements are bar charts and pie charts
-
Reserve space for time-sensitive data
- Reserving a portion of dashboard for temporarily urgent data ensures important, time specific information is front-of-mind for board members
Direct attention to potential concern areas
Dashboards will likely include more financial metrics than the board can discuss each time they convene, so finance leaders should focus board attention on the most urgent trends illustrated in the dashboard.
Finance leaders should set principled discussion triggers—quantitative values for each KPI that, if reached, signal the institution’s ability to sustain its mission is at risk. Incorporating concrete triggers into the dashboard establishes a clear system to determine which metrics a board should—and should not—focus on when convened.

Construct a narrative around dashboard data
A higher education institution’s financial goals and KPIs must ultimately link to teaching, research, and student success outcomes. Displaying the right KPIs with effective visualizations and contextual data can accomplish this, but finance leaders should also share written or presented narratives to ensure board members are connecting the dots between financial data and mission goals. Narratives also ensure that board members interpret dashboard metrics uniformly and accurately.

Engage academic leaders with dashboard data
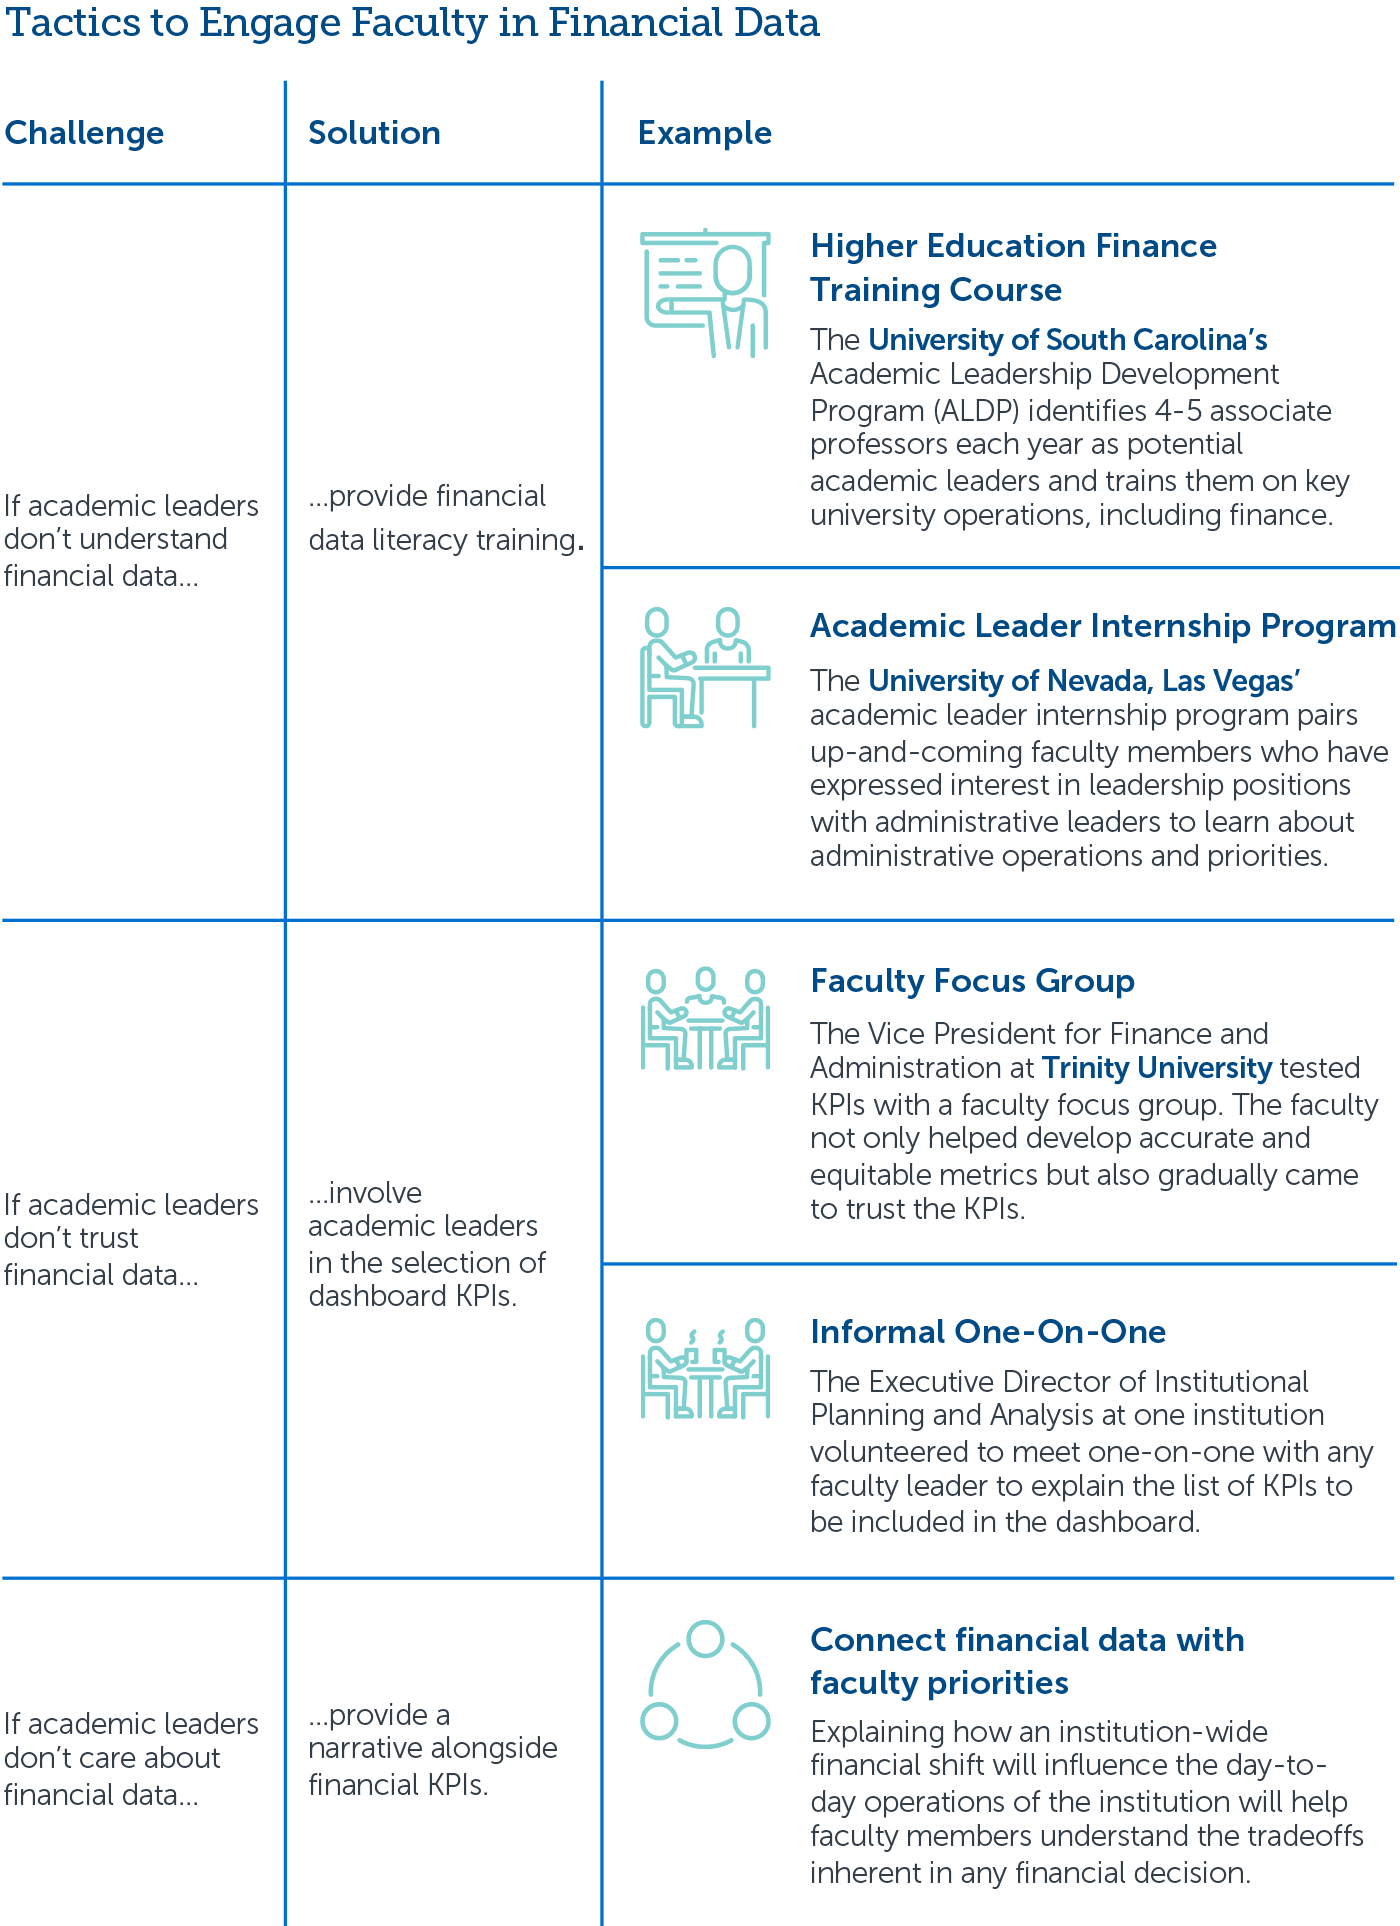
Academic leaders and other institutional stakeholders can also benefit from engaging with financial data. In fact, some business leaders deliberately share their unaltered board-facing dashboards with their academic leaders in order to demystify board proceedings and build a culture of trust and transparency. Finance leaders should consider the tactics illustrated in the graphic below to effectively redeploy board-level dashboards with academic audiences.


This resource requires EAB partnership access to view.
Access the roadmap
Learn how you can get access to this resource as well as hands-on support from our experts through Strategic Advisory Services.
Learn More