It’s no surprise that graduation rates correlate with grade performance. However, few of our members are using this reliable graduation indicator to target advising efforts and success initiatives. The chart below illustrates graduation rates, broken down by first year GPA, from one of our members (a public flagship in the Midwest).
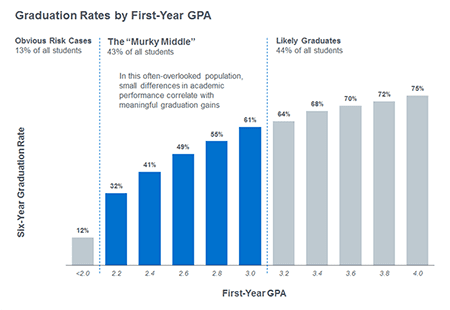
We’ve analyzed this same chart at dozens of schools and found that, while graduation rates differ, the same “hockey stick” pattern emerges regardless of institutional type or selectivity. From this analysis, we’ve developed three insights we hope will inform your efforts.
Use Big Data to Boost Revenue and Student Achievement
1. Any first year student below a 3.0 GPA should be considered at-risk
Most institutions do not consider students at-risk until they’re in danger of academic probation. Yet, in our analyses, we almost always see a drop in graduation rates for these so-called “Murky Middle” students who earn just below a B average.
2. Growing evidence suggests that the murky middle represents a high ROI opportunity
The difference in two-tenths of GPA (the equivalent of improving just two letter grades for a full-time first year student) correlates with a graduation rate increase of as much as 10%. This may not be mere correlation: a growing body of evidence shared by members indicates that targeting support to the “Murky Middle” returns meaningful graduation gains down the road.
Evaluate the Strength of Your Student Success Strategy
3. Students below a 2.0 GPA almost never recover, despite our considerable efforts
A lion’s share of academic support is already dedicated to the students at the far left of the chart. At most schools, however, just 10-15% of those students will right the ship and make it to graduation.

More Blogs

3 ways to combat the student loneliness epidemic on your community college campus

Students need career support earlier. Here’s a scalable way colleges can provide it.
Student Success Blog