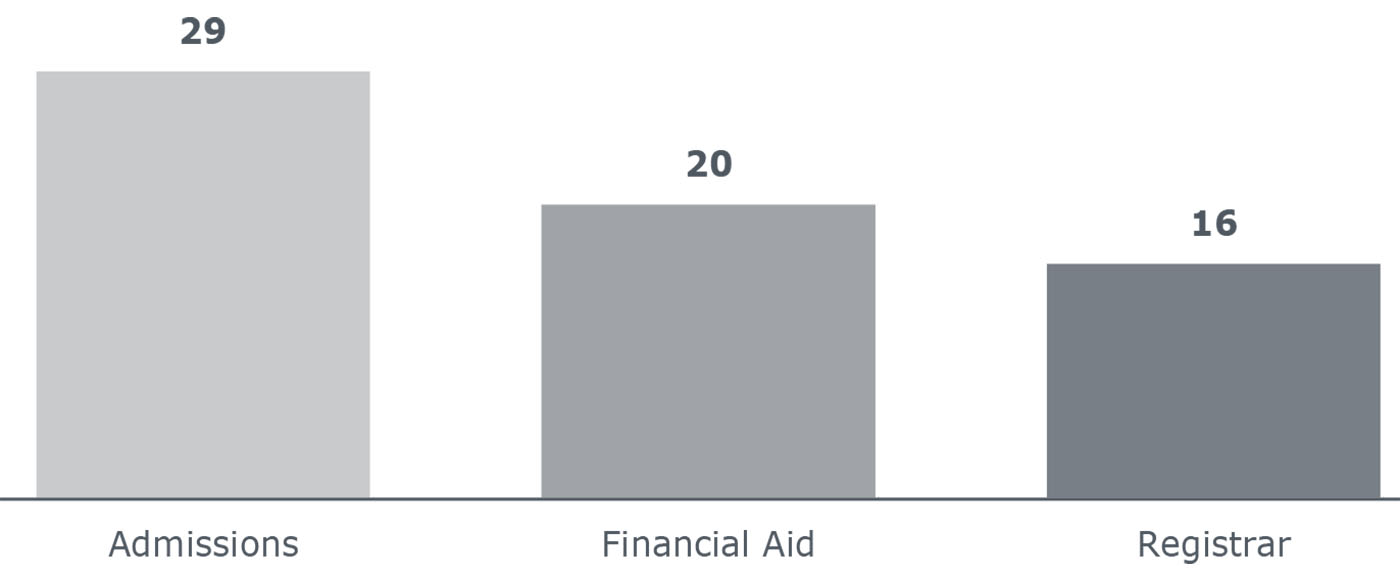
More staff allocated to admissions than other core offices
Staffing is always a concern for enrollment managers (EMs). Particularly in today’s climate of declining revenue and new focus on student outcomes, EMs need to make sure that the three core enrollment management offices—admissions, financial aid, and the registrar—are staffed to meet demand for their resources.
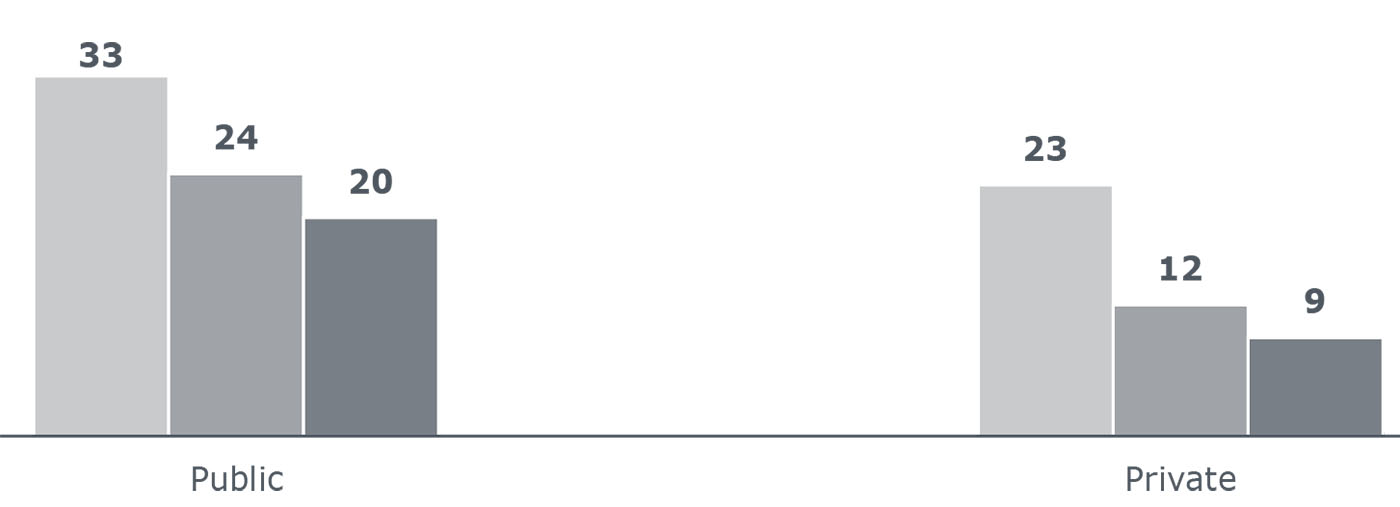
As part of the Enrollment Management Benchmarking Survey, we asked enrollment managers how they staff these three core functions. Across all institution types, admissions offices have more employees than financial aid and the registrar.
More Staff Allocated to Admissions than Other EM Functions
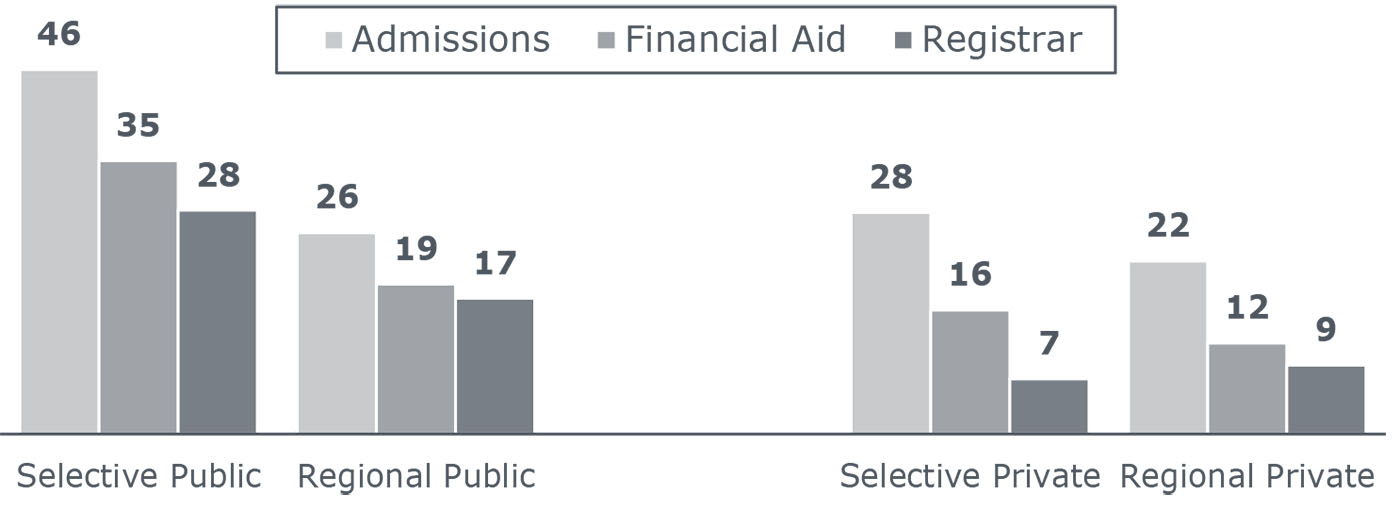
Average Total Staff in Core Offices, All Schools and by Segment
Admissions staff productivity: a public-private analysis
Because the number of admissions staff corresponds with the institution’s total enrollment, we calculated two measures of admissions staff workload that take enrollment into account:
- Number of applications per staff member
- Number of new students per staff member
As the graph below shows, the ratios vary significantly between public and private institutions
Publics Operate at Scale that Privates Cannot Match
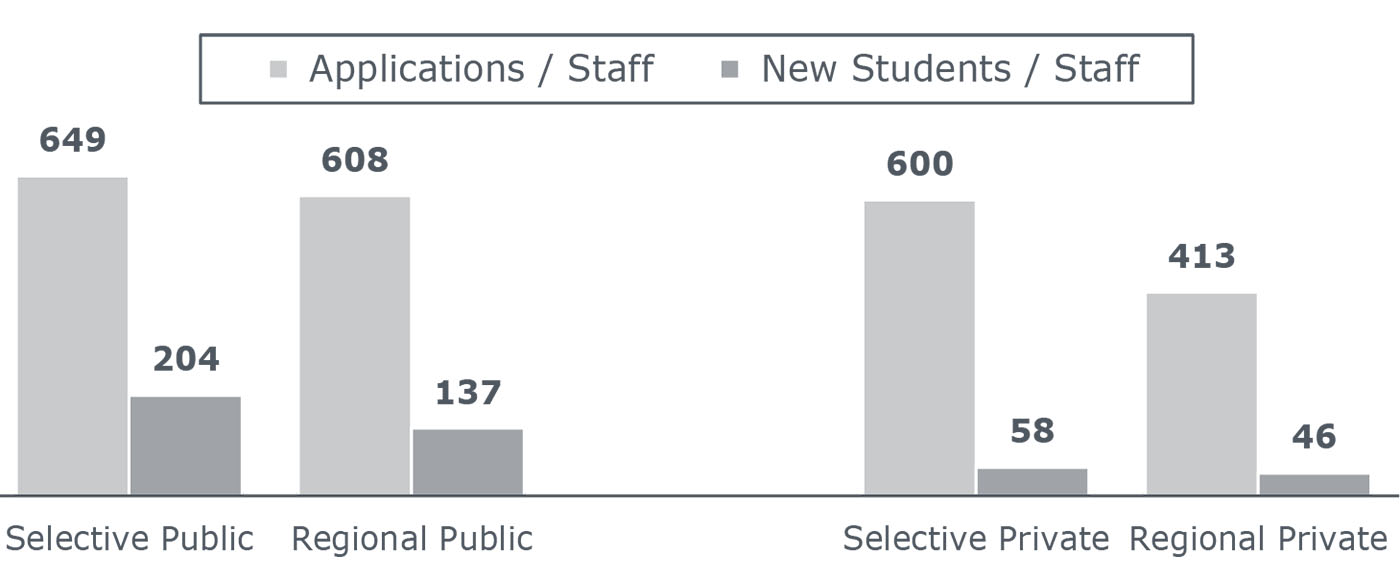
Average First-Time, Full-Time Applications per Admission Staff and New Students per Admission Staff, All Schools and by Segment
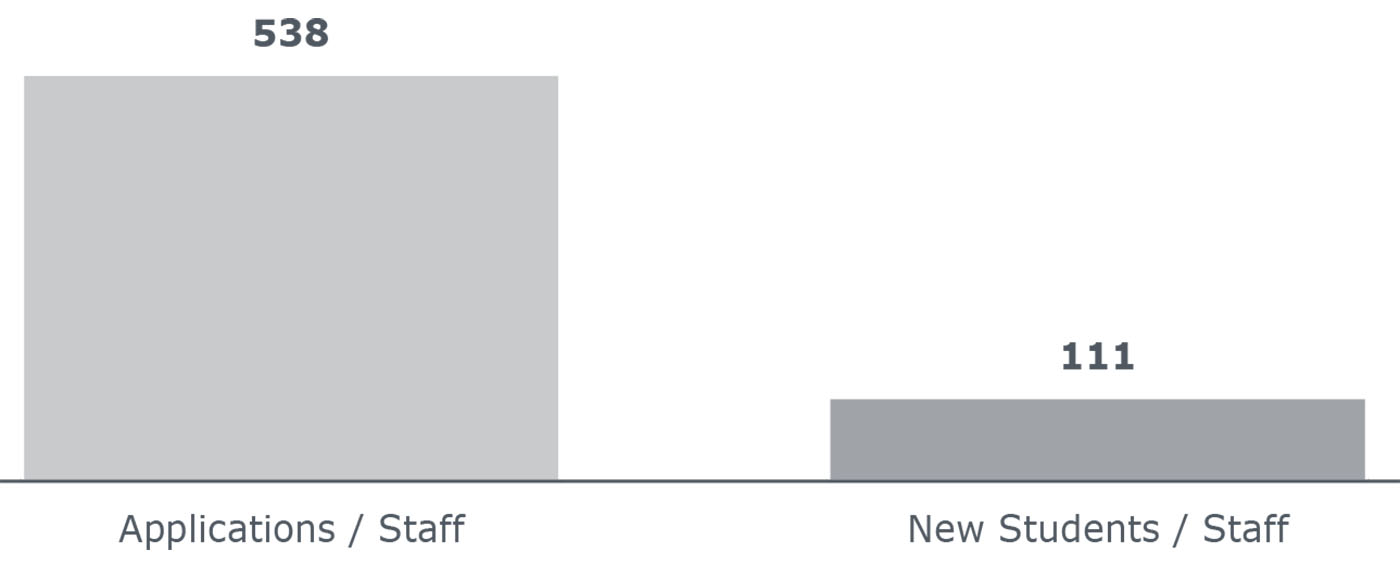
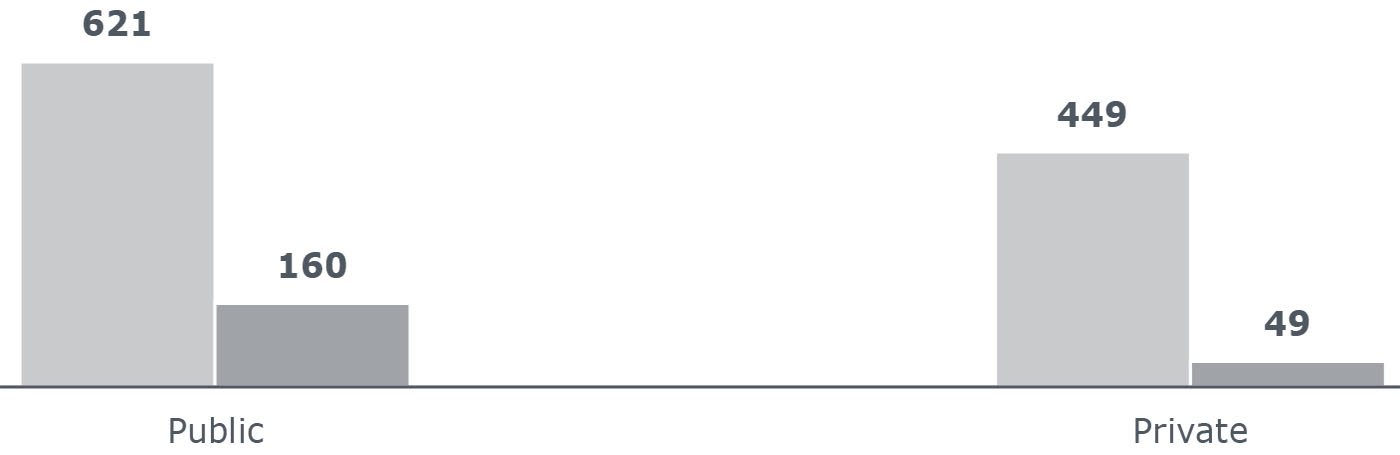
When it comes to newly enrolled students per staff, the difference between public and private institutions is clear: most public institutions operate on a scale that smaller, private institutions simply cannot match. Each individual admissions staff member at a public university accounts for 160 new students, whereas each staff member at a private institution accounts for 49 new students. Thus, private universities have to allocate more staff to recruit the same number of students.
Make sure your admissions office is staffed to meet demands
The applications-per-staff metric highlights the enrollment challenge facing regional private institutions. The other three segments—selective publics, regional publics, and selective privates—have between 600 and 649 applications per staff member. The corresponding 413 applications per staff member at regional privates suggest that they do not generate enough demand to operate at the scale of other universities. However, reducing investment in admissions staff could have detrimental effects on recruitment at a time when these institutions are in need of additional enrollment.
Admissions staff at private universities are more focused on recruitment
To better understand the distribution of admissions staff, the survey asked EMs to identify the distribution of admissions staff across six roles:
- Traveling recruitment staff (travel a substantial part of the time)
- Regional recruiters (based away from campus)
- Campus-based (travel can occur but is not main role)
- Processing, clerical
- Management
- Other
The results across all institutions are outlined below.
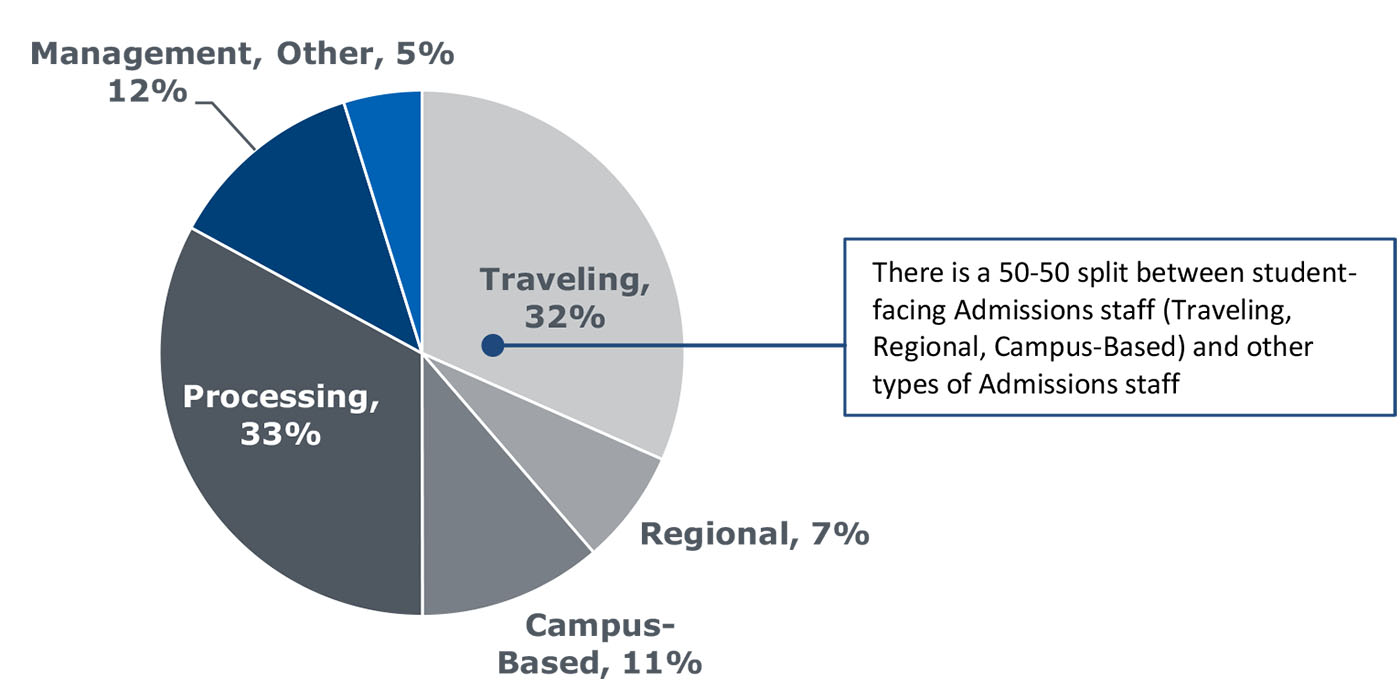
50% of Admission Staff Have Student-Facing Roles
Distribution of Staff in Admissions
The following chart represents the same data for public and private universities.
Admissions is More Recruitment-Focused at Private Institutions Percentage of Staff Performing Role, by Sector
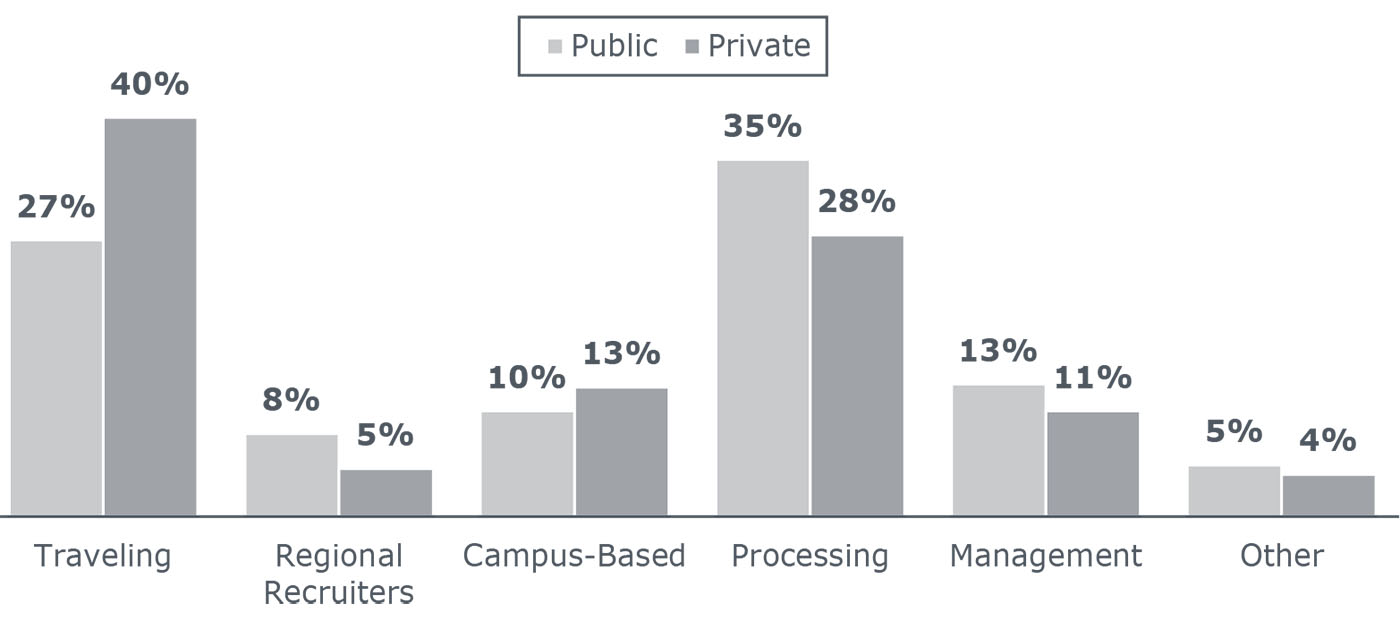
Private universities allocate a higher percentage of staff to recruitment roles versus back office roles like processing and management. Grouping the student-facing categories (traveling, regional recruiters, and campus-based staff) together, 58% of admissions staff at private institutions are dedicated to student-facing recruitment.
This contrasts with public institutions, where only 45% of staff are allocated to these same functions. Public universities likely have more responsibilities related to processing and administration due both to their higher volume of applications and greater oversight by state governments. Private universities, by contrast, can allocate more of their staff to the student engagement that matters most in recruiting.
These small but notable differences in staffing structure reflect the respective challenges in each sector, and provide helpful benchmarks for enrollment managers looking to assess their admissions staffing.
Get more insight on EM organizational structures
Our Enrollment Management Benchmarking Survey collected data from 87 enrollment managers about their organizational structures, staffing and salaries, budgets, and vendor relationships. Read the second part of the survey findings, Enrollment Management Snapshot: EM Staffing and Salaries, for more information about staffing the three core EM units. Download the report.