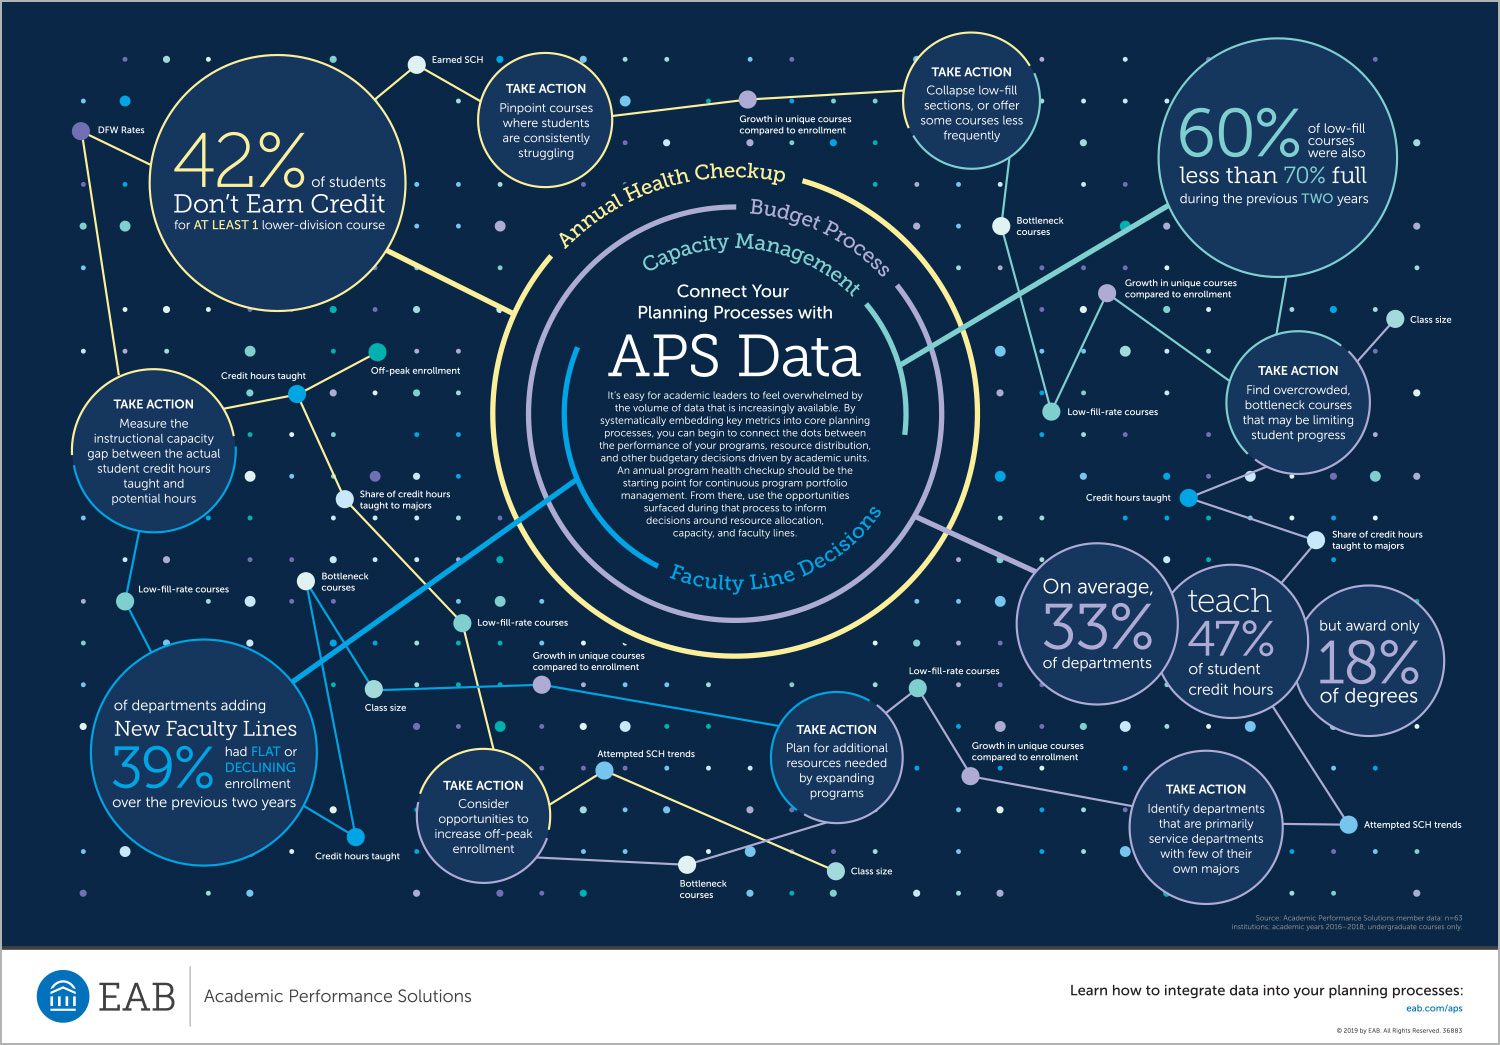
It’s easy for academic leaders to feel overwhelmed by the volume of data that is increasingly available. By systematically embedding key metrics into core planning processes, you can begin to connect the dots between the performance of your academic programs, resource distribution, and other budgetary decisions driven by academic units.
An annual program health checkup should be the starting point for continuous program portfolio management. From there, use the opportunities surfaced during that process to inform decisions around resource allocation, capacity, and faculty lines.
Use our latest infographic for ways to connect your planning processes with APS data.
More Resources
Infographic
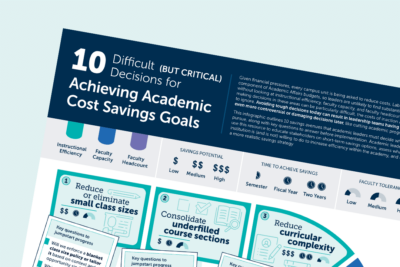
10 difficult (but critical) decisions for achieving academic cost
10 difficult (but critical) decisions for achieving academic cost
savings goals
The infographic is designed to help provosts, deans, and CFOs make decisions about where and how to achieve…
Strategic Advisory Services

Resource Center
Academic Innovation Resource Center
Our academic innovation research examines proven best practices and cutting-edge ideas for transforming the academy and preparing for…
Strategic Advisory Services

Research Report
2024 Voice of the Dean Survey: Inaugural Executive Brief
EAB’s Voice of the Dean Survey gathered responses from deans nationwide to jump-start essential conversations for college leaders…
Deans Advisory Services