Understanding the revenues and costs of UK universities
As financial pressures intensify across higher education, it’s critical that all stakeholders grasp the fundamentals of university budgets. Our high-level overview below highlights the sector’s dependence on diverse revenue sources and its primary cost drivers. At its core, higher education (HE) is a human capital enterprise—where lecturers, students, and staff play a central role in shaping both revenue and spending. Armed with this understanding, institutions can evaluate where there may be room to manoeuvre within their budgets and where the current model may impose constraints.
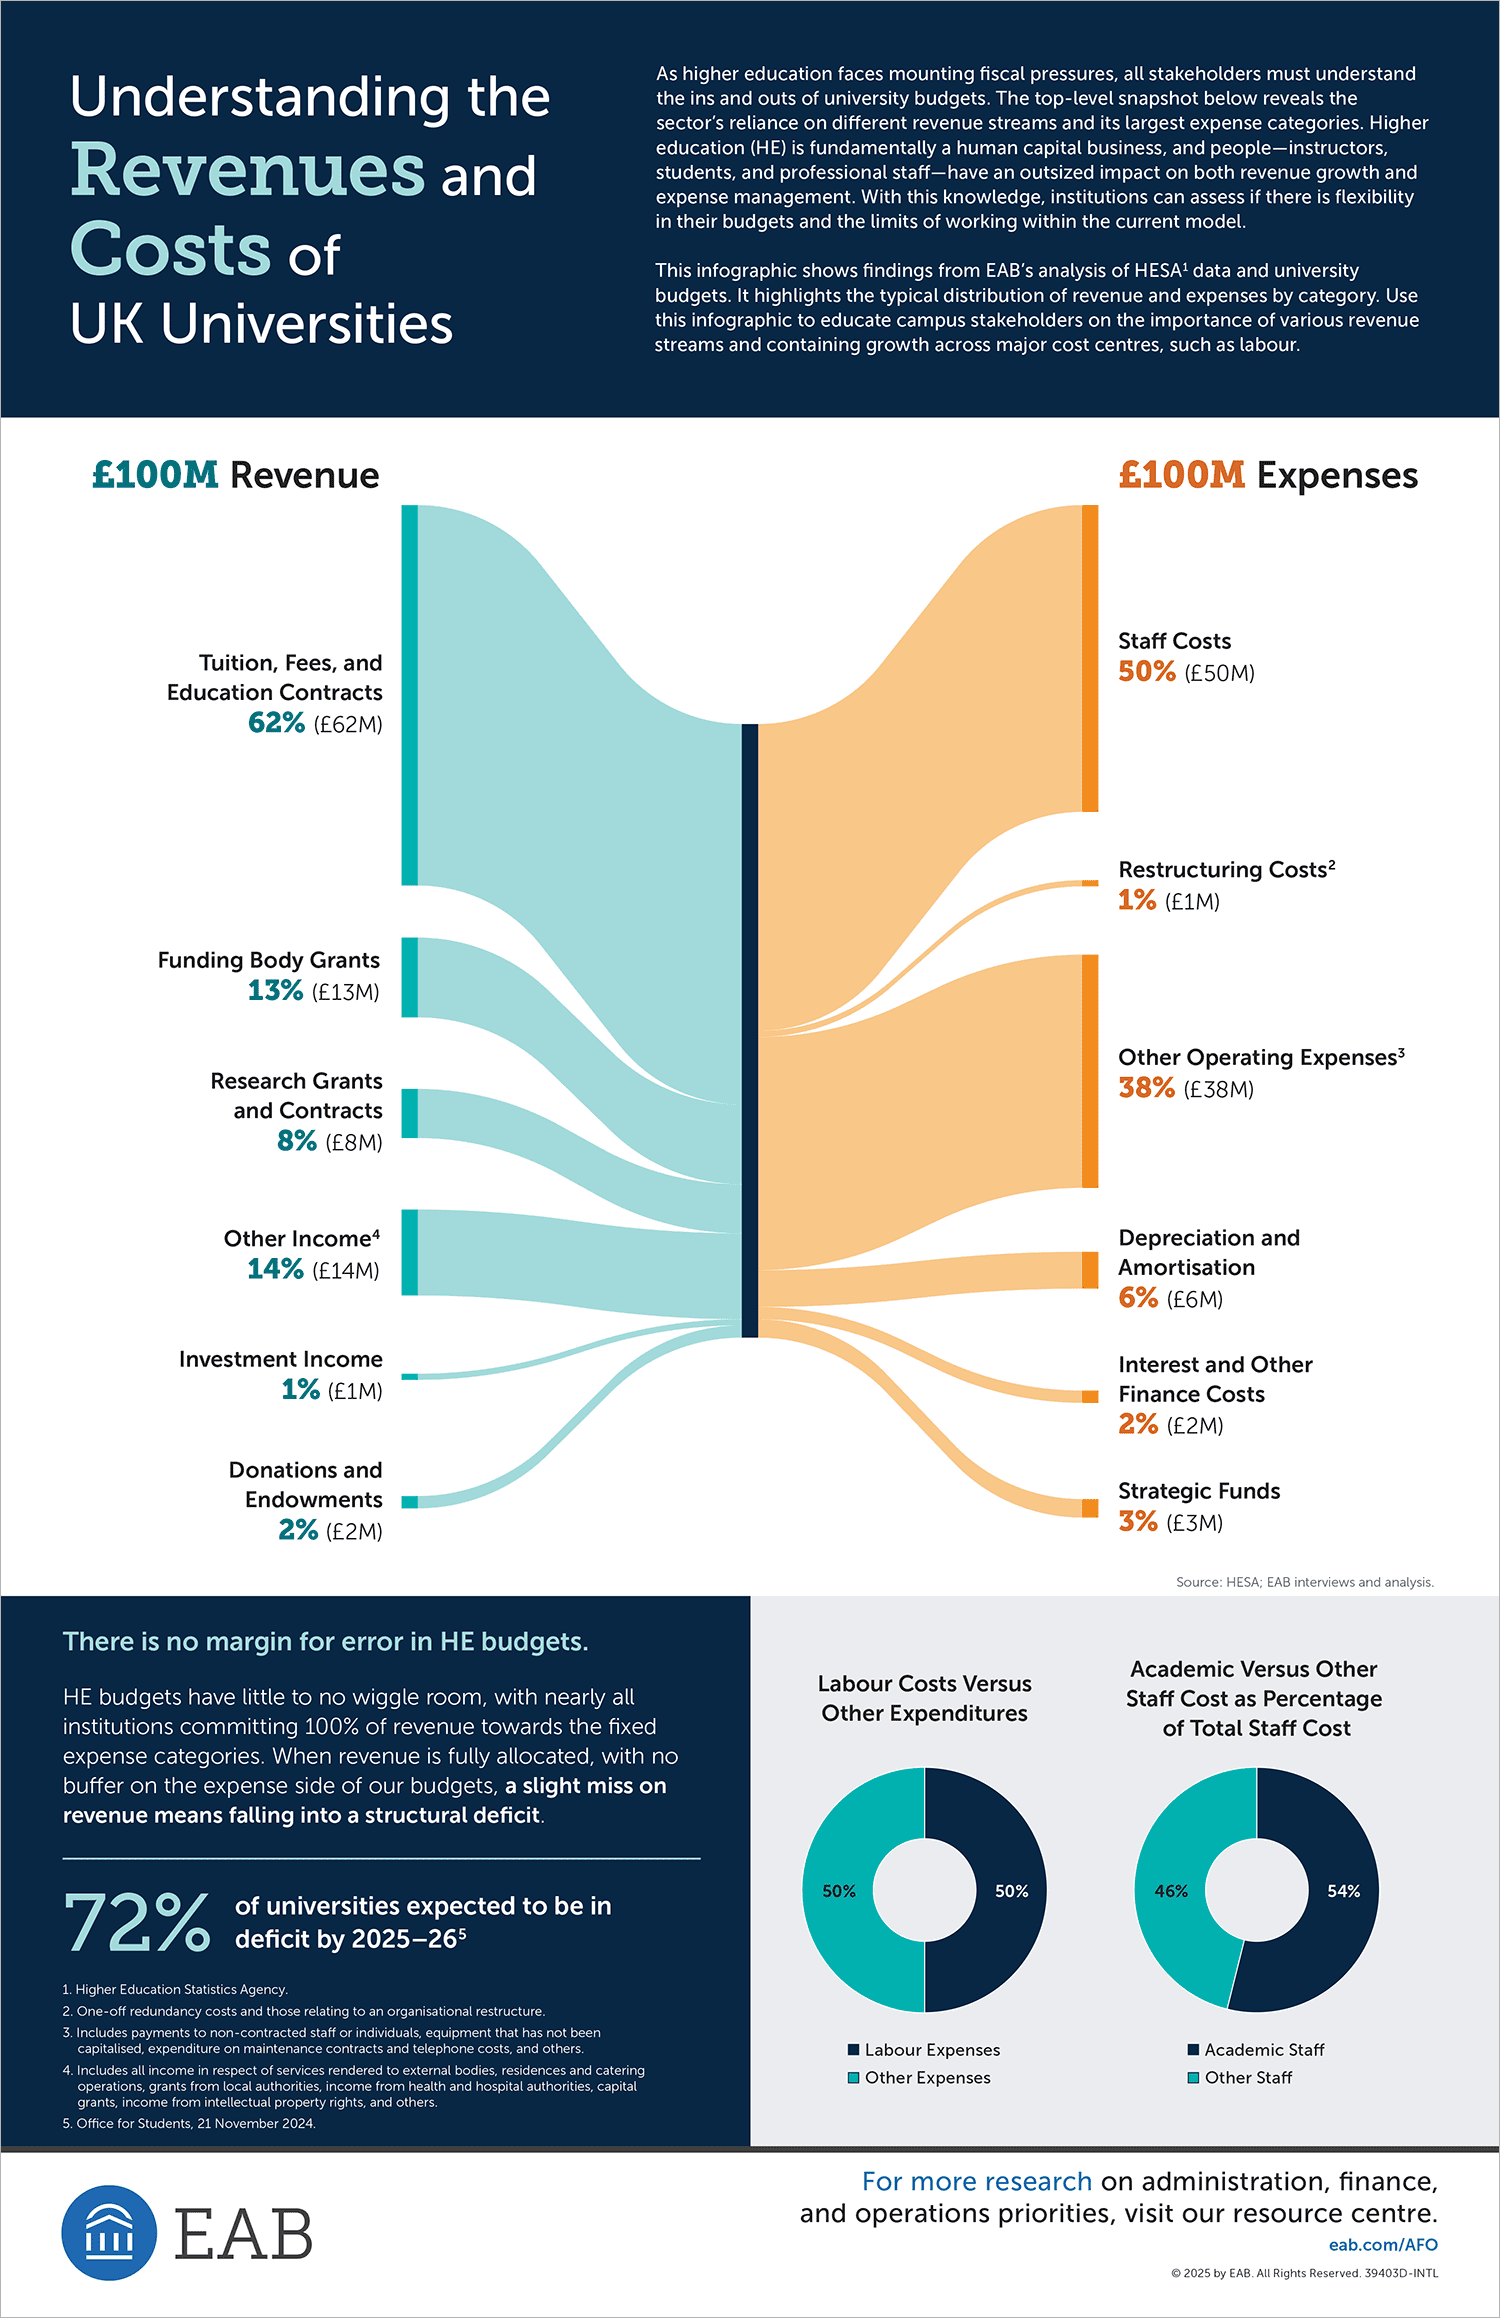
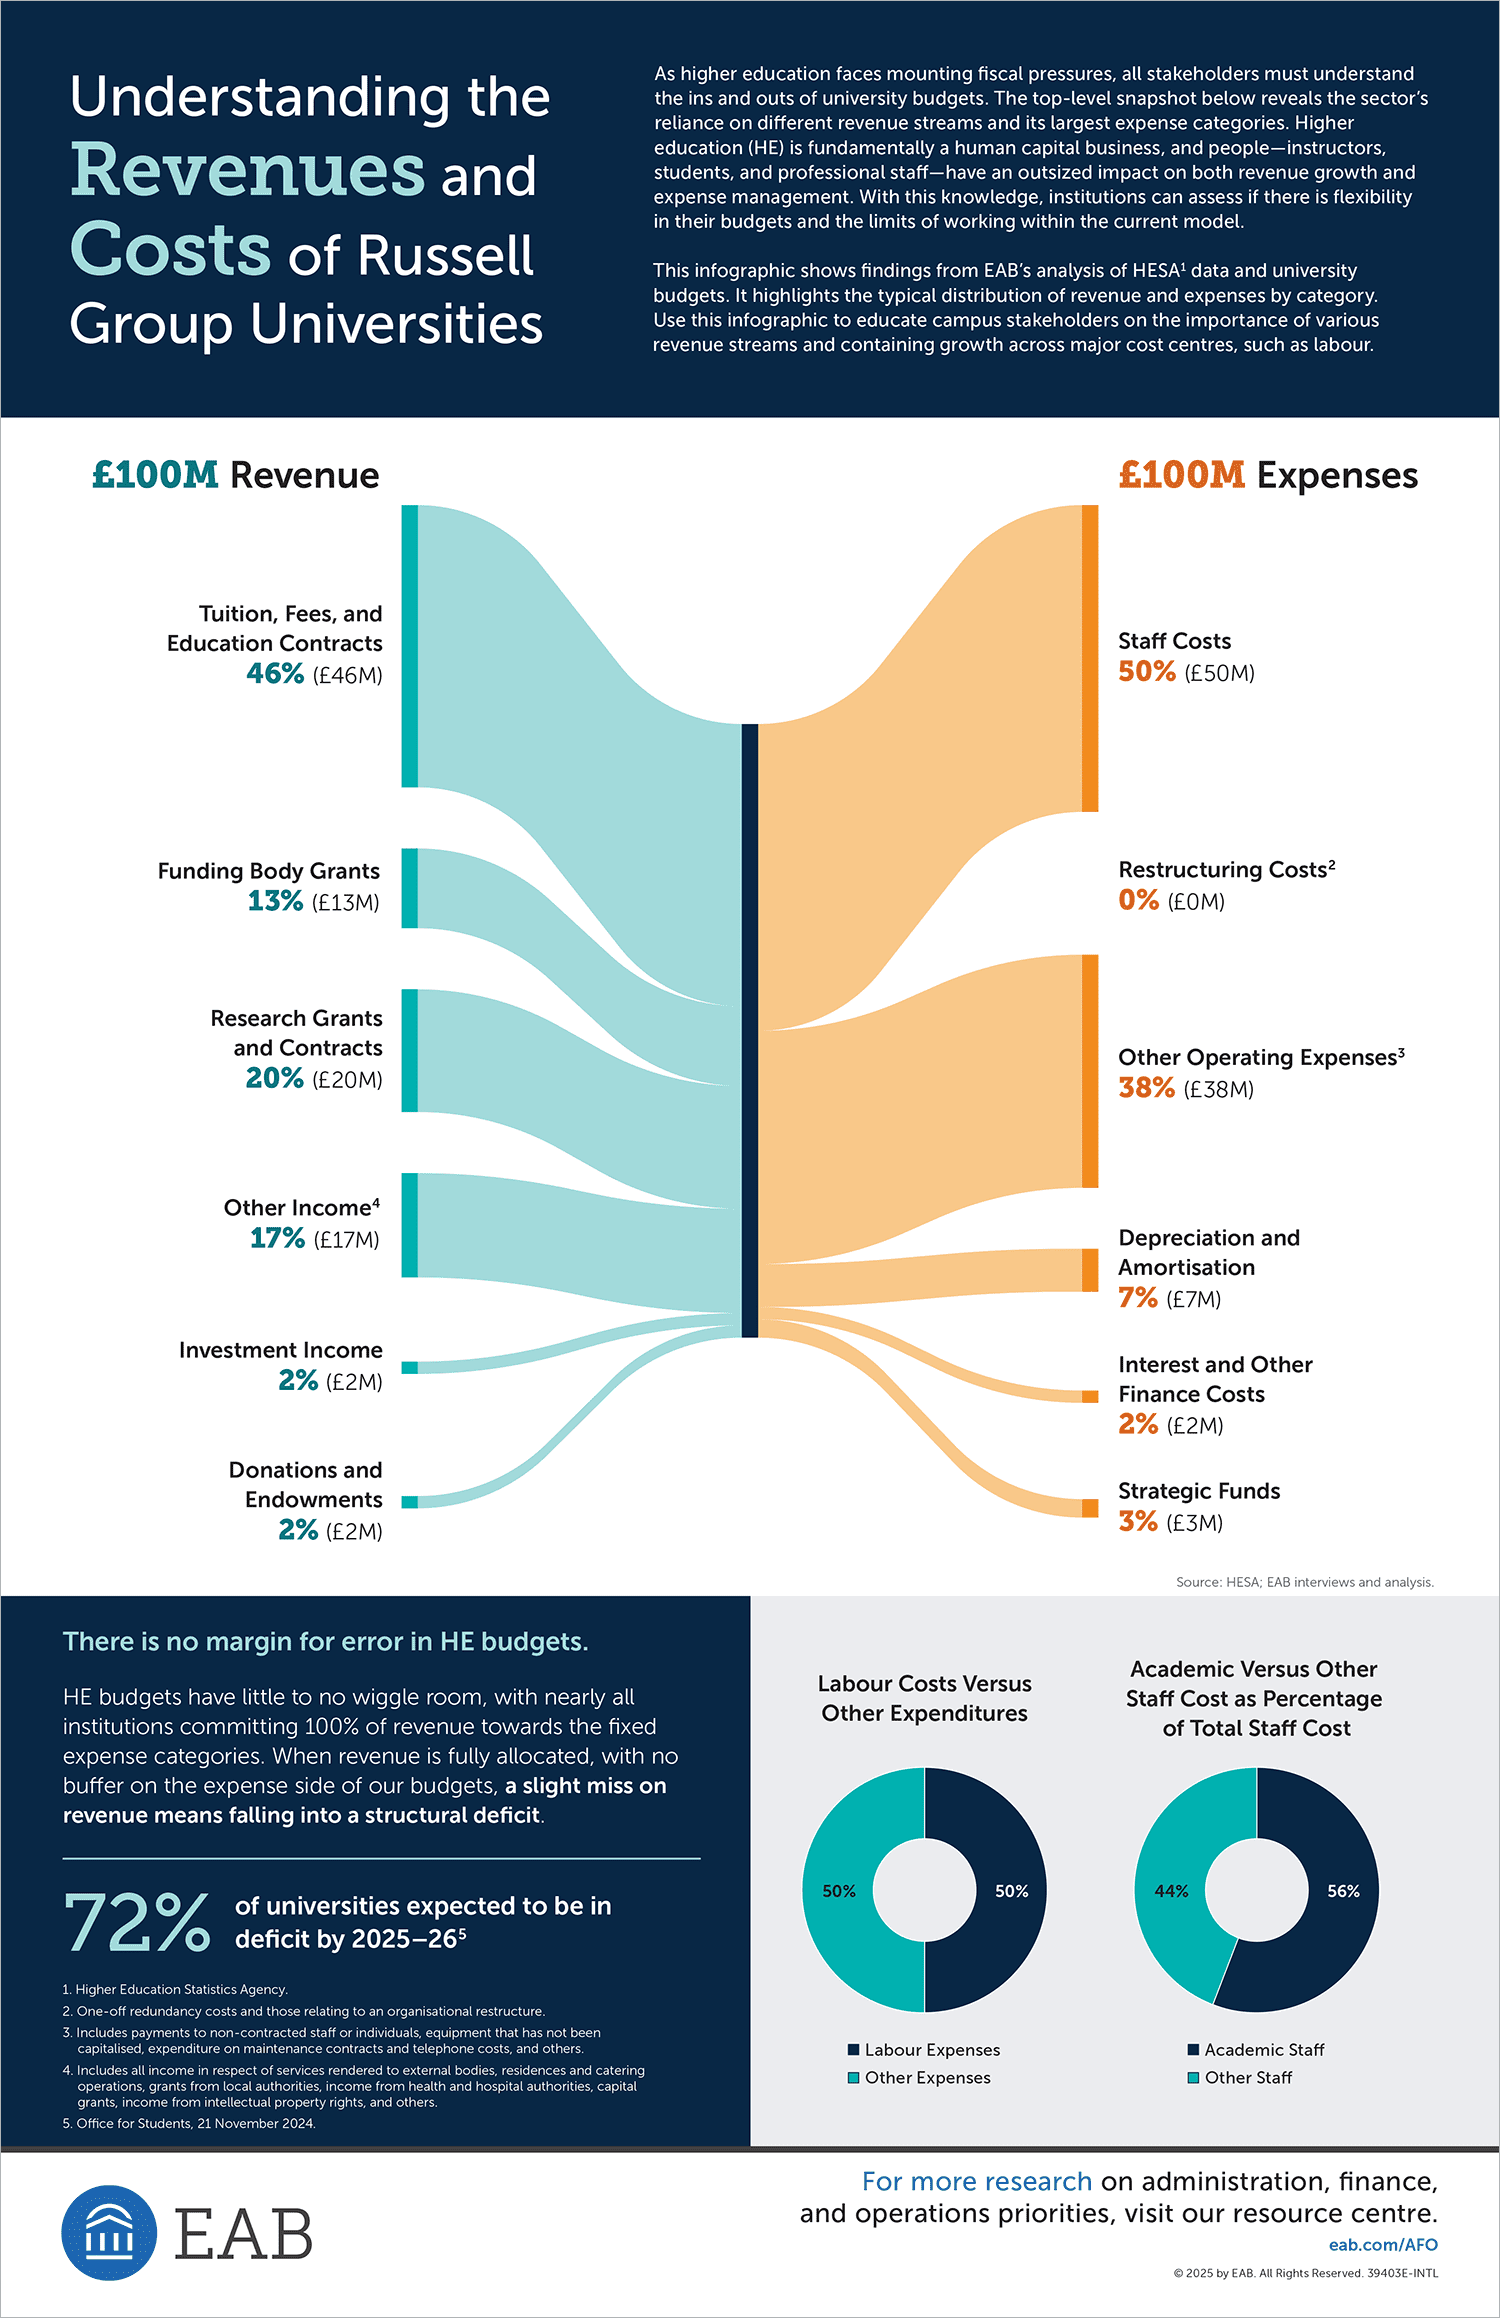
These infographics show findings from EAB’s analysis of HESA data and university budgets. They highlight the typical distribution of revenue and expenses by category for:
Share these infographics with campus stakeholders to demonstrate the key role of different revenue sources and the need to mitigate expenses in major cost areas, such as labour.
More Resources

How The University of Helsinki Turned a Funding Crisis into Lasting Administrative Efficiency

Alternative revenue strategies for higher ed leaders