These instructional capacity metrics are outdated. Here’s what to use instead
September 19, 2018, By Alexa Silverman, Senior Director, Student Experience and Well-Being Research
The science of measuring instructional capacity was built on decades of steady growth in higher education, reflecting long-held quality standards and the assumption that adding resources is the only way to maintain or improve quality. Many of these measures were built into rankings like the U.S. News and World Report, despite minimal pedagogical research on optimal class sizes, course loads, or student-to-faculty ratios.
As a result, historically accepted targets for course enrollments and faculty workloads live on, largely based on averages of course sizes and student-to-faculty ratio that lack nuance about the range of student and faculty experiences within academic departments.
MAXIMIZE YOUR UNDERUTILIZED INSTRUCTIONAL RESOURCES
To remain sustainable in the face of change, universities must stop “managing to averages” and move toward actionable measures of quality that recognize disciplinary differences and create flexibility to accommodate student need.
Learn three outdated instructional capacity metrics and three new analyses that better reflect the new realities of higher education and the everyday experiences of students and faculty.
New metric: Student credit hours per instructor (by type/rank)
Old metric: Student-to-faculty ratios
Traditionally, student-to-faculty ratios have been used as a resource allocation tool and quality control mechanism. This metric was often an indicator for programs to add tenure lines or cap enrollment. A lower ratio signaled higher quality and an average ratio was meant to reflect the typical student experience. However, increased volatility in enrollment has made it difficult to maintain these metrics for all programs.
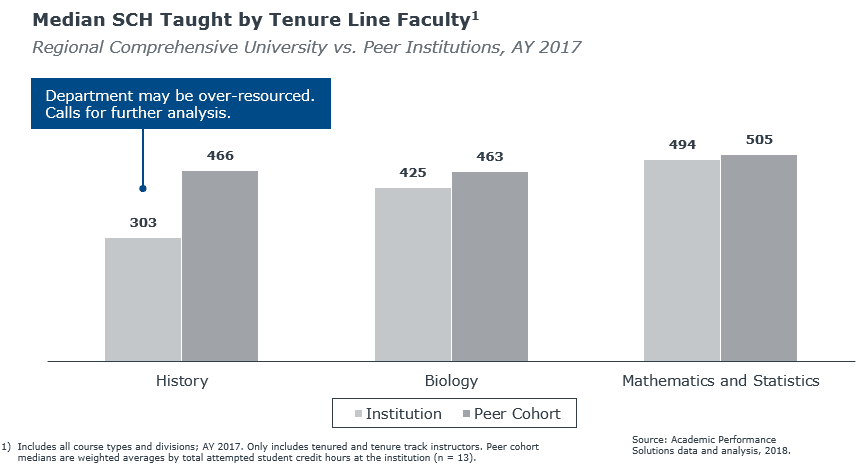
Using median student credit hours (SCH) taught per instructor instead allows for more flexibility. Comparing data on student credit hour production by department can reveal which units are under-resourced or over-resourced. Across departments, deans can identify areas where there are significant disparities in instructional capacity or where capacity has not kept up with growth.
In the example below, data from EAB’s Academic Performance Solutions shows how three departments from one regional university stack up against comparable departments at peer institutions. Tenure line faculty in the biology and mathematics departments have similar SCH production, whereas the history department is much lower compared to peers.
New metric: Course size distribution
Old metric: Average class size
Measuring average class size is based on the assumption that smaller classes have better learning outcomes and that most students are in average-sized classes. In response to growing enrollment, colleges and universities would add more sections to keep the average class size small.
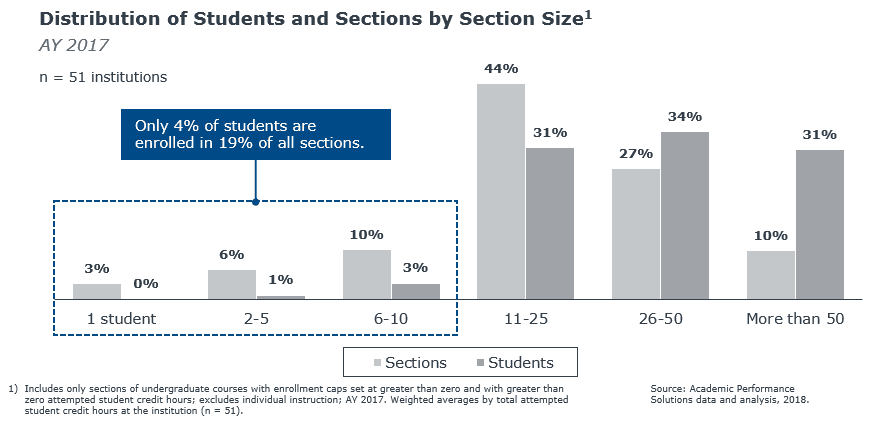
Instead, colleges and universities should look at the distribution of courses by size with the distribution of students by course size, to paint the full picture of student experience and capacity. This eliminates misconceptions stemming from the so-called “law of averages” and highlights potential mismatches between investment and return on small courses.
For example, while 19% of sections have 10 or fewer students, only 4% of students are enrolled in these courses. On the other hand, 31% of students are enrolled in courses with more than 50 students, which accounts for only 10% of total sections.
New metric: Section fill rates
Old metric: Maximum section size
Maximum section size should be based on pedagogical necessity, but is often set based on faculty preference or available room size. Rather than simply reporting back the maximum capacity of a section, using the section fill rate metric captures the efficiency of how resources were used.
Student enrollment in course sections averages about 60% of maximum capacity at most colleges and universities, with as many as 20% of all sections less than half full. In particular, universities commonly offer more sections of multi-section courses than are necessary to meet student demand. In many cases, the number of sections could be reduced substantially without significantly inconveniencing students. Cancelling these sections could reduce adjunct costs, or it could free up faculty time to support bottleneck courses or spend more time on research.
NAVIGATE BOTTLENECK COURSES AT YOUR SCHOOL
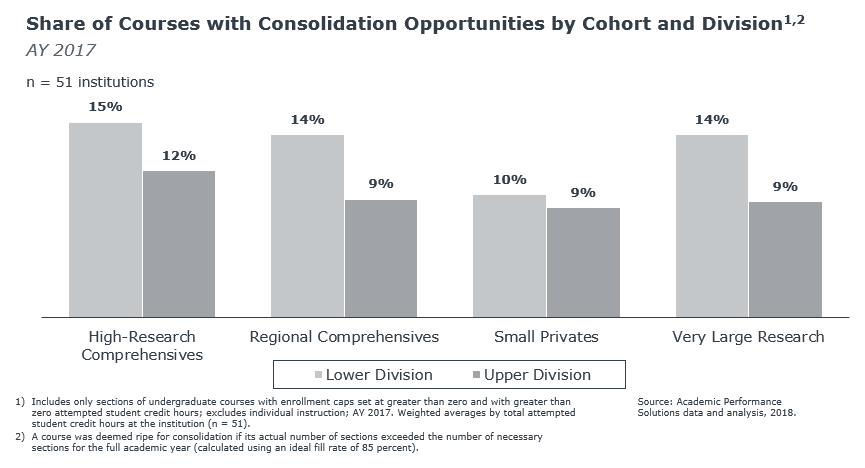
Consolidation opportunities are found more often among lower division courses than upper division ones. As a greater proportion of courses at smaller, private institutions are offered just once per semester or term, consolidation opportunities are less common. However, these schools are also the most susceptible to another potential discovery of fill-rate analyses: access bottlenecks. Among lower division courses at these small private institutions, about 15% are at or over capacity.

More Blogs

4 reasons to streamline your data reporting

Was the impact of remote instruction as bad as we feared? Here’s what the data shows