What the looming demographic storm means for your state
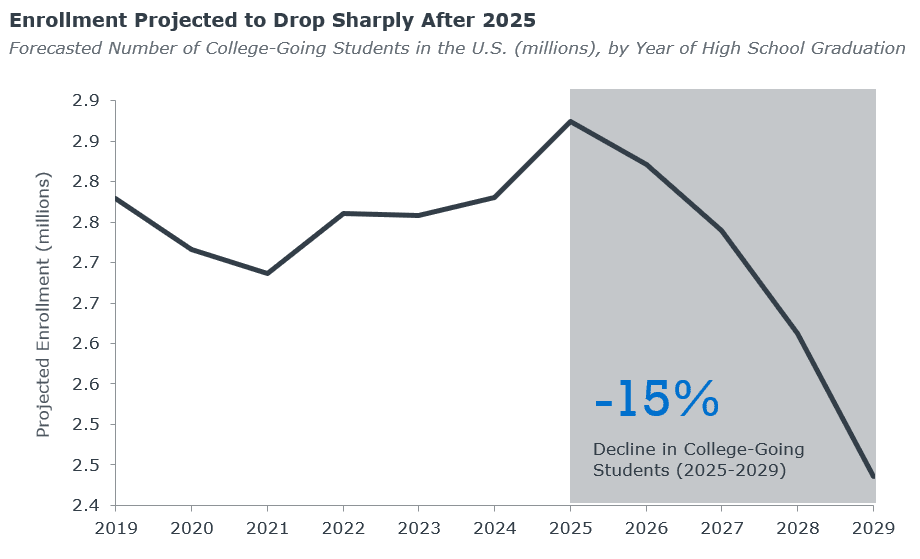
Enrollment leaders are by now all-too-familiar with higher education’s challenging outlook: the enrollment cliff, driven by declining birth rates and shifting demographics. Between 2025 and 2029, the number of college-going students will decline by 15%— that’s over 400,000 fewer students in a span of four years, an average loss of 100,000 students per year.1
Why is college enrollment declining?
College enrollment is declining following the Great Recession (2008-2009), known as the “birth dearth,” which was so abrupt and substantial in nature that it led us to fall off a demographic cliff after 2025. The number of college-going students is projected to decrease by 12% over the next decade due to a sharp drop in fertility following the Great Recession.
What’s more, the profiles of our students are changing. They are becoming more diverse, with a greater range of academic ability and higher financial needs. It will be more challenging—and expensive—to recruit and retain these students, just when pressures mount on government funding from other sectors, such as healthcare and social security.
State-by-state impact: Who will be hit the hardest?
Institutions need better data and more specific regional information to be able to plan effectively. In markets that are inherently local for most institutions, the national forecasts with the accompanying doom-and-gloom narrative only help so much. National averages conceal crucial regional differences. Consider this: between 2017 and 2029, enrollment in four-year institutions will increase by six percent in California, while enrollment in Arkansas drops by 35%.
How can higher education leaders prepare for this potential enrollment crisis?
To support institutional planning and better inform decision-making, EAB’s Enrollment Management Forum has developed state-level dashboards to give you an overview of demographic, affordability, and funding trends for all 50 states and D.C. The State Outlooks are divided into three sections.
Access EAB’s State Outlooks to get insight into trends and pressures specific to your state’s institution.
Section 1: Demographic Trends
Using data from Nathan Grawe’s Higher Education Demographic Index, the first page provides projected figures of college-going students from 2017 to 2029, breaking them down by demographic characteristics and by the institution type they are anticipated to attend.
Section 2: Affordability Trends
The second page highlights affordability metrics for states benchmarked against other states. How does the median income in your state compare against the national average? Are your state’s institutions less affordable to the typical family than institutions in neighboring states? What kind of loan burdens are your graduates carrying?
Section 3: Funding and Appropriations Trends
Finally, it’s especially important for public institutions to be aware of trends in funding and appropriations. Is your dependency on tuition increasing over time or leveling off? Can you make a case to your state legislature to allocate more tax revenue to higher education?
1Based on projections from Nathan Grawe’s Higher Education Demand Index available here: https://people.carleton.edu/~ngrawe/HEDI.htm. Accessed 2.7.2019.
Looking ahead: Preparing for the future of higher education
The enrollment cliff is inevitable, but institutions that adapt strategically will be better positioned to thrive. Use our latest Enrollment Management State Outlooks to dive deeper into the trends and pressures specific to your state and the states where you target recruitment efforts. Further, use the Outlooks to facilitate a more data-driven approach in cabinet-level meetings and discussions with boards and university leadership. Access the State Outlooks.
More Blogs

Questions universities should be asking about recruitment strategy
How to uncover hidden threats in past enrollment trends