What does application growth mean for enrollment outcomes?
Many colleges have seen an increase in applications in recent years, even as the number of college-bound students has decreased. This, along with persistent staffing issues within admissions teams, has led some enrollment leaders to question whether it is worth allocating scarce resources to drive further application growth.
At EAB, we have a team of analysts dedicated to studying the dynamics of enrollment challenges like this. Their research found that application growth is essential not just for increasing enrollment but for preventing enrollment losses as well. Our analyses of large sets of national application and enrollment data show that schools that have grown enrollment have largely done so via outsized application growth. In other words, colleges that drive increased application activity are likely to enroll more students. This is the case across states, sectors, and schools of differing selectivity.
The connection between application volume and enrollment outcomes across all colleges
To determine the efficacy of an application volume-based approach to increase enrollment, and therefore how worthwhile it is to court additional applicants, we analyzed the most recent five years of application and enrollment data available through IPEDS for four-year institutions across the United States.
Overall, the results show that schools whose enrollment grew between fall 2017 and fall 2021 also grew their application volume—and the more applications grew, the more enrollment grew. The other side of the coin is that the more applications shrank, the more enrollment shrank. In fact, the effect on enrollment was even stronger when applications decreased: schools whose application volume shrank by only 7% typically lost an outsized 22% in enrollment over this period.
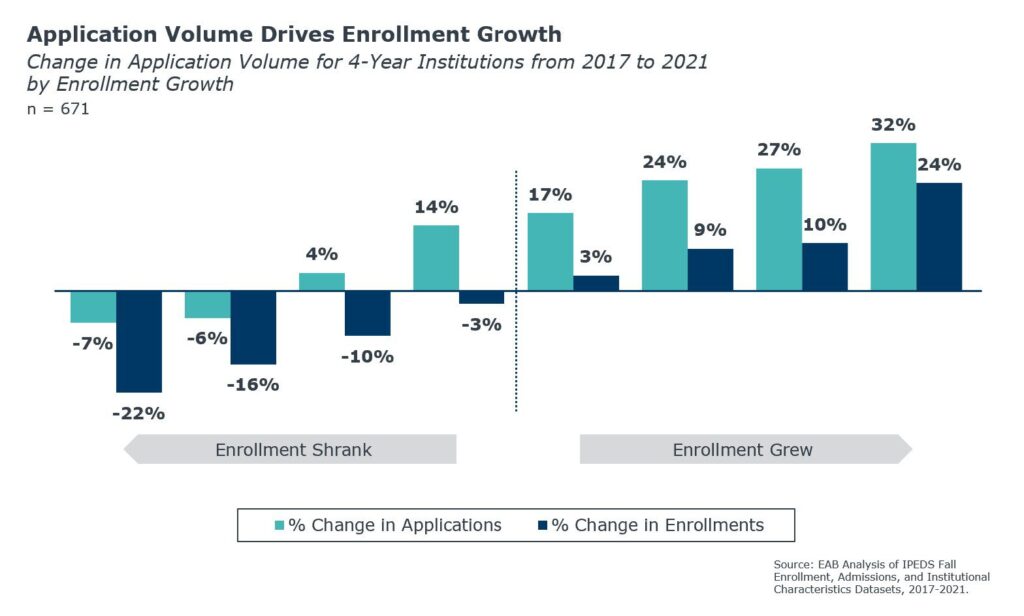
This demonstrates that there is a persistent and positive relationship between application volume and enrollment (even when comparing public and private institutions). Not only that, the data also show that this relationship does not plateau, meaning that schools don’t typically hit a point of diminishing returns on additional applications. The more one grows their application volume, the more enrollment they capture—even in the face of shrinking college-going rates during the same period.
Application growth appears to be so important that, over the five-year period studied, if a school wasn’t growing applications by at least a moderate amount, its enrollment likely shrank. The pivot point at the center of the chart demonstrates this, where we see that if an institution isn’t growing their applications by at least 17% on average over a five-year period, then their enrollment decreases. Even maintaining flat enrollment demands increased application volume!
The connection between application volume and enrollment outcomes across states
As you know, examining the relationship between application volume and enrollment outcomes at the national level can obscure important regional differences that stem from variation in demographics and other local issues. We therefore set out to explore whether the relationship between applications and enrollment varies between states. The results show that, while the strength of the relationship varies from state to state, the basic relationship between the volume of applications and enrollment growth holds. The only exceptions to this were several states (in grey) where we couldn’t make a statistically significant inference.
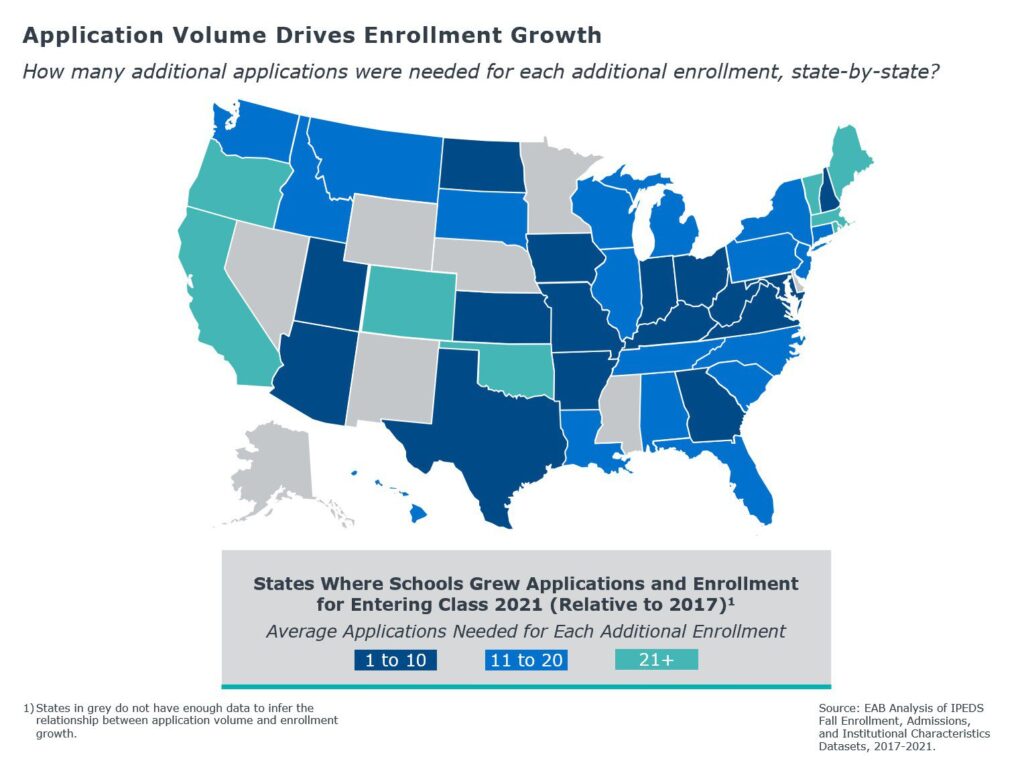
The next step was to evaluate the strength of this relationship in real terms: How many additional applications were needed for each additional enrollment from 2017 to 2021? Nationwide, 13 additional applications resulted in 1 additional enrollment for the average school. State by state, though, it ranged from 1 to 10 additional applications needed for each increase in enrollment in some states, to a maximum of 55 more applications in extreme cases. For most states though, the rate fell within a modest range of 11 to 20 applications per enrollment for the typical school.
Given the varying demographic trends that underlie this, we were also curious about regional patterns. It appears that, while states with the strongest relationship are found in all regions of the country, requiring fewer than 10 additional applications for each additional enrollment, many in the northeast and west required 21 or more applications for each additional enrollment. This might suggest that the shifts in population and college-going rates already facing several of these states demanded a higher volume of applications from out-of-state.
-
States where enrollment grew the most
The two states with the highest growth in college enrollment—Arizona and Florida—also had the highest growth in applications.
-
States where enrollment shrank overall
Schools in the states where college enrollment shrank overall were able to beat that trend and grow enrollment by increasing application numbers, even when only modestly increasing volume. This underscores the importance of application volume. Pennsylvania, Indiana, and West Virginia are just a few of the states where enrollment shrank overall but many institutions were able to increase enrollment through higher application volume.
-
States where applications grew the most
Schools that only slightly increased their application numbers in states where overall application volume dramatically increased were likely to still lose enrollment. This suggests schools in states that attract more applications overall might have stiffer competition for a share of enrollment. Arizona and Florida stand out here as well, along with Idaho, Colorado, North Carolina, Montana, Wisconsin, and Ohio.
How does application volume affect enrollment growth for non-selective schools?
The next component we wanted to explore was whether selectivity affects this connection. Do selective schools uniquely benefit from this application boom, or can non-selective schools also benefit from increasing their application volume? The outcome showed that non-selective schools demonstrate the same overall relationship—those whose enrollment grew had significantly increased their application volume. That said, the relationship does differ somewhat between selective and non-selective schools.
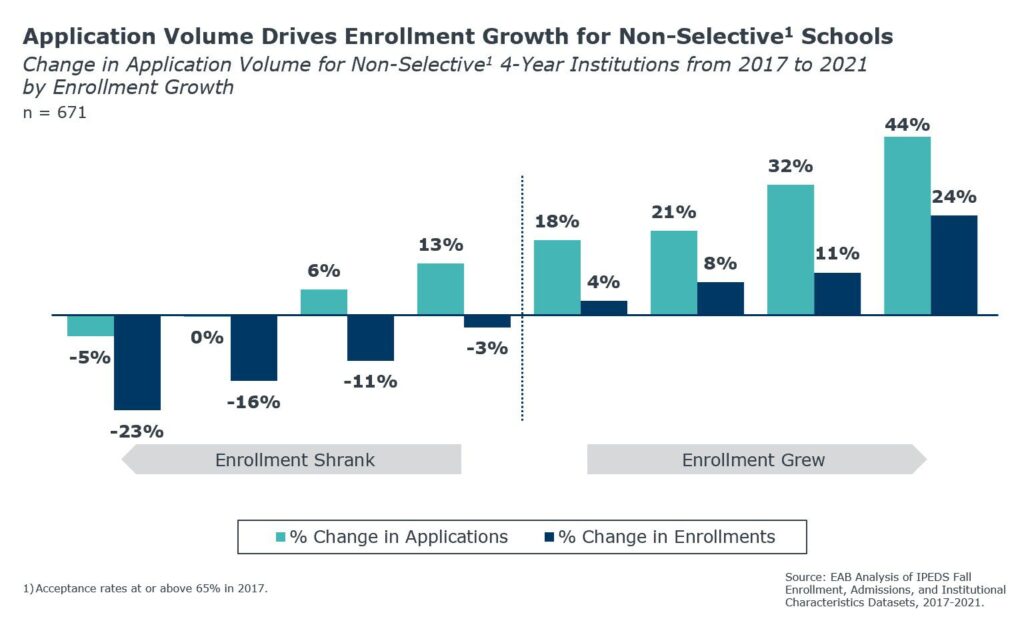
Increasing application volume is very important for non-selective schools, with no evidence of the relationship diminishing at the highest levels of enrollment growth. However, these schools required much more application growth (44%) than selective schools (28%, shown below) to fuel the highest increases in enrollment (23 to 24%). Magnifying this need, even modest application growth (6 to 13%)—or worse, remaining flat with applications over this 5-year period—resulted in large drops in enrollment (up to -16%).
At the other end of the scale, application volume didn’t decrease by much across non-selective schools, but those that had even the slightest drop (-5%) ended up with huge drops in enrollment (-23%). This could mean that these schools face tougher competition, where a larger proportion of those applying end up not pursuing a 4-year degree—or perhaps following the nonconsumption trend and going directly into the labor market.
How does application volume affect enrollment growth for selective schools?
The overall relationship between application volume and enrollment outcomes applies to selective schools as well. There are some important differences between the shape and strength of this relationship though, when compared with non-selective schools. For selective schools, the relationship between application and enrollment growth is more potent in some ways. For example, selective schools required less application growth to fuel large gains in enrollment when compared with less selective schools (28% vs 44%, respectively).
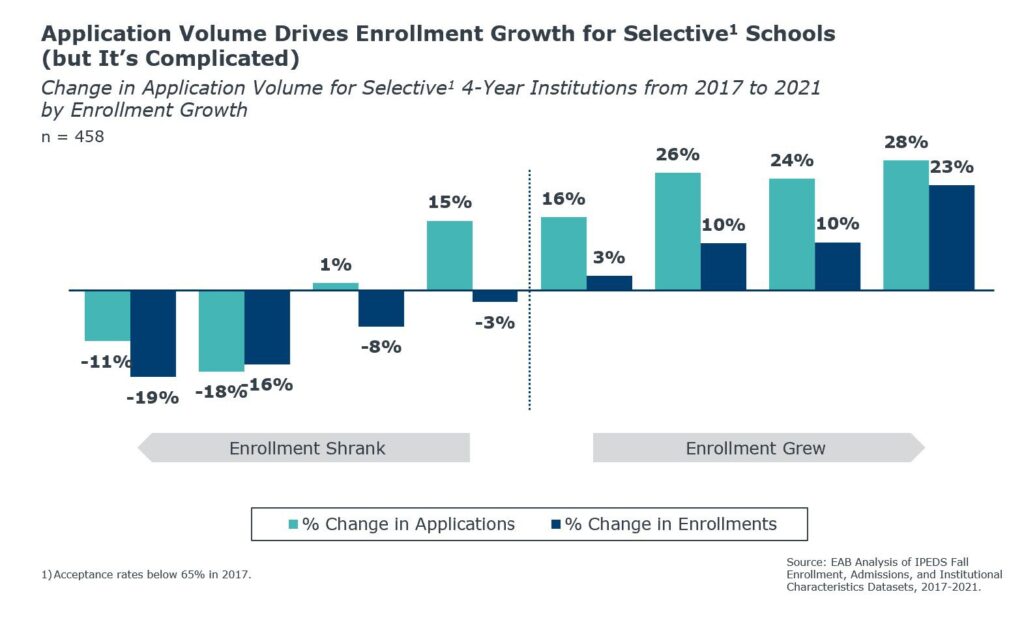
There are still downsides for selective schools, though, with some losing upwards of 19% of their enrollment from 2017 to 2021. However, those enrollment drops required greater contractions in application volume: a 10 to 20% decrease in volume for selective schools, as opposed to a mere 1 to 5% decrease for similarly large drops in enrollment at non-selective schools.
The primary way in which this relationship differs between selective and non-selective schools is the flatness of marginal application growth among selective schools that grew enrollment to different degrees. The gap in application growth between those that increased their enrollment modestly (10%) and those that grew their enrollment the most (23%) is quite small, with only a 2% difference in their respective growth of application volume. This could indicate diminishing marginal returns on additional application volume for selective schools—a point is reached at 20% or more application growth where additional applications are not needed for higher enrollment.
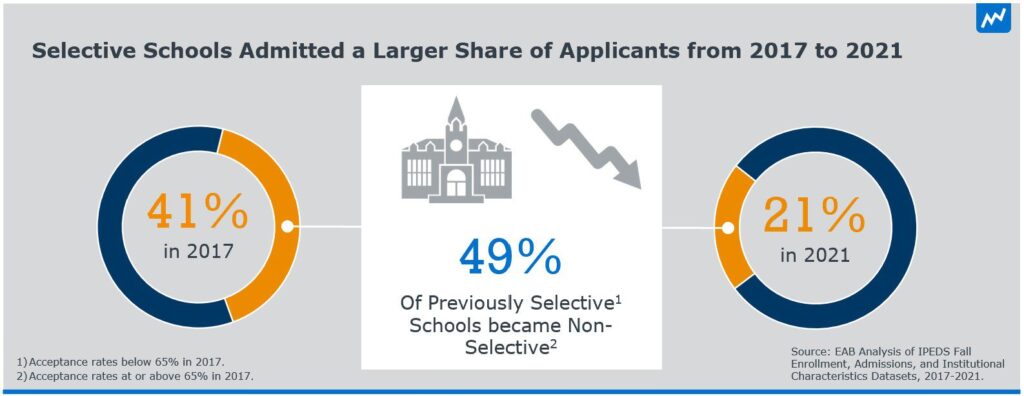
This likely results from the unique ability of many selective institutions to simply admit more out of their already large applicant pools. This is validated by a decrease in the number of selective schools (those with <65% acceptance rate) from 2017 to 2021, which resulted from increased admissions rates among a large proportion of them during this period. In fact, 49% of institutions that were selective became non-selective.
What drives the relationship between application volume and enrollment outcomes?
Given the apparent effectiveness of a volume-based strategy, this approach becomes even more important in this era of increasing non-consumption and shrinking college-age populations. But what drives this relationship?
There are multiple factors driving the connection between applications and enrollment. For example, several studies in the past decade have shown that students who apply to more schools are more likely to be accepted by at least one of them. This means that a volume-based approach to enrollment may help schools attract and enroll students who might otherwise fall through the cracks—especially in the case of underrepresented students.
For a general explanation of why this might be the case, we can turn to a Public Health model: even if an outreach campaign is less effective on an individual level, it can influence more people overall through casting a wider net. In the context of college admissions, this means that it can be more effective to reach out to more prospective students. It will likely convert more, even if it means that the yield rate is lower.
If you aren’t growing applications, you’re losing enrollment
Enrollment leaders must allocate their scarce resources wisely. Some have tried to do this by focusing their recruitment efforts solely on students who are already most likely to enroll. This strategy can save money on marketing and reviewing applications, while also boosting yield. However, the analyses highlighted here show that focusing recruitment outreach on a smaller pool of students is risky for bottom-line enrollment. High application volume drives enrollment growth! Schools can barely maintain flat enrollment while the overall number of college-bound students is declining, even with modest application growth, so reducing outreach only compounds that structural issue.
What does this volume-based imperative mean for enrollment strategy? Given the limited resources of most enrollment offices, inviting more applications to review may seem daunting. It will be best to address the problem from multiple directions, such as by finding the right leads in a larger audience to fill your marketing funnel while also increasing the throughput from inquiry to admission. In the former case, it remains essential to find the right leads when casting a wider net. After all, a strategy with a lot of leads can be unproductive if they’re the wrong leads, which just overwhelms the system. That’s why it’s important to cast your net in a wide, diverse pool of highly engaged students that you can connect with directly. In the latter case, improving process efficiency to triage applications (such as through recent developments in AI technology) could help enrollment offices manage the larger application volumes required to meet their enrollment goals.

More Blogs

5 digital marketing channels enrollment teams should prioritize

How to identify new recruitment markets without starting from scratch