Barriers to equity in student success
When institutions analyze their student success data, they often focus on common student success metrics like first-year retention and graduation rates. As these metrics are lagging indicators of institutional and student performance, academic leaders may not know the root causes of any given demographic disparity in their data. To help solve this problem, EAB has developed the Barriers to Student Success Infographic and Implementation Planning Guide.
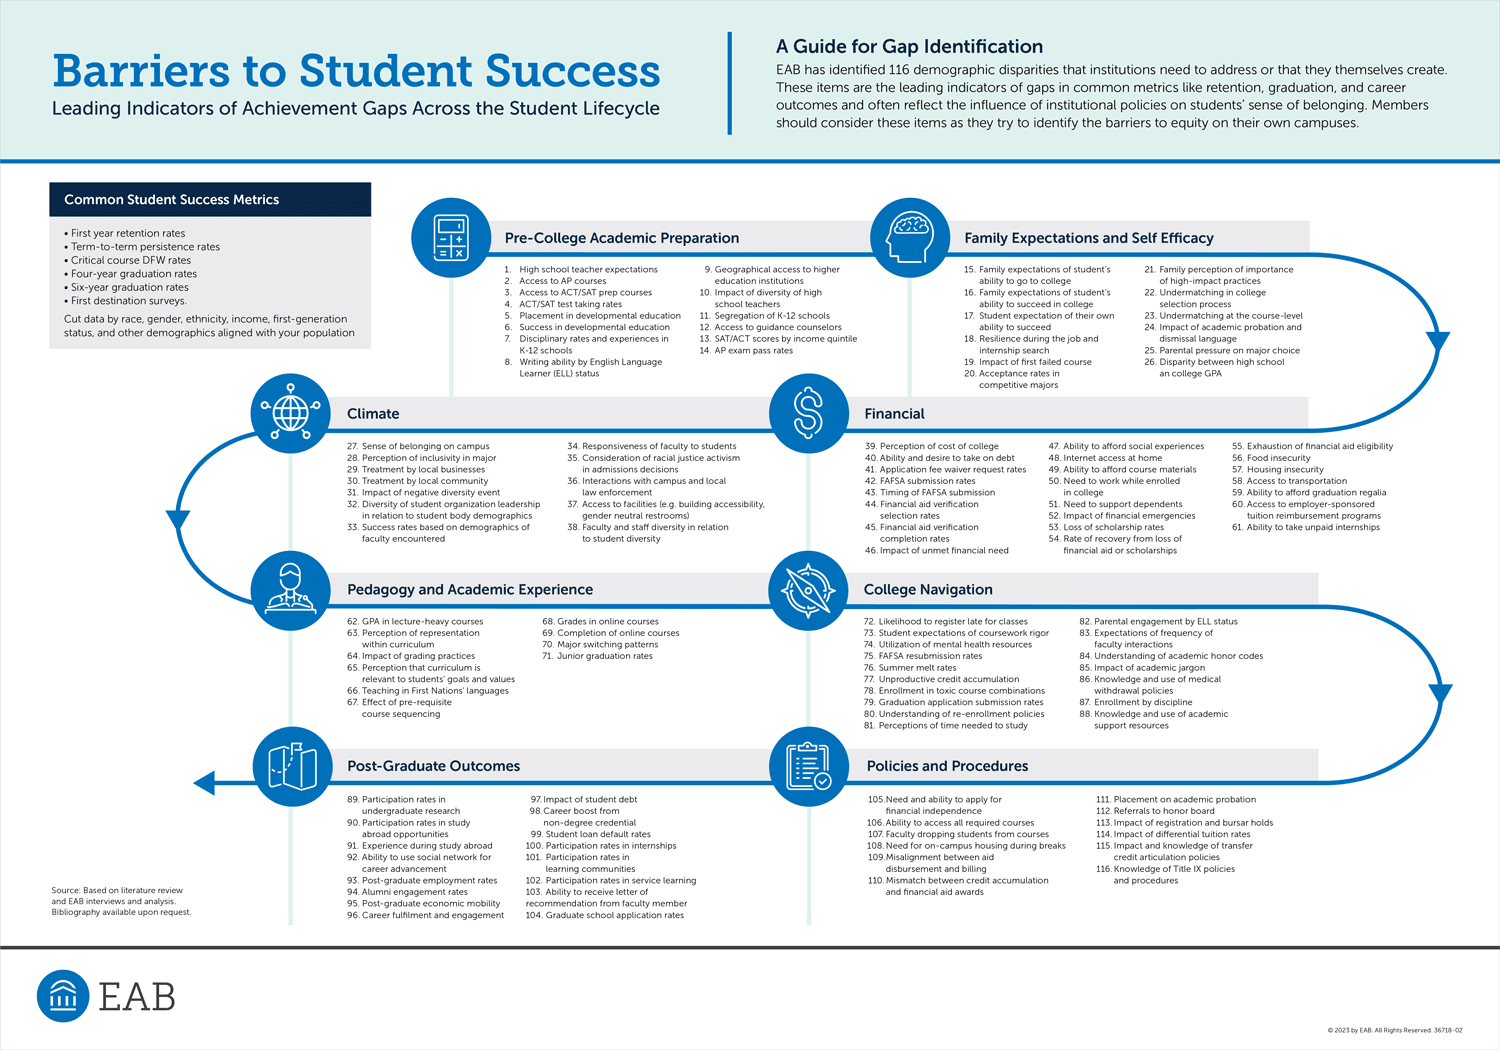
The Barriers to Student Success Infographic is a collection of 116 leading indicators of demographic disparities in common student success metrics like retention, academic performance, graduation, and career outcomes. The list should help student success taskforces and leadership teams brainstorm areas for improvement in their own students’ experiences.
The Implementation Planning Guide will help institutions conduct the necessary analyses on their campus to identify demographic disparities and their corresponding leading indicators, prioritize their student success efforts in relation to their strategic goals, and task student success, faculty, and staff leaders to craft solutions.
More Resources
5 components of student belonging

Inclusion and Belonging Resource Center for Higher Education