3 limitations of traditional administrative benchmarking
Every few months, a version of this question lands in EAB’s inbox: “Our board is concerned about our number of administrators. Can you benchmark our faculty-to-staff ratios against peers?”
While usually framed as a data request, this question is really a political volley. When regents or trustees ask about administrative benchmarks, what they often want is a quick, clean number to validate a preexisting narrative about excessive administrative growth in higher education.
Benchmarks can serve this purpose, but they don’t tell college and university leaders the two things they actually need to know: whether their administrative structure is designed to support the institution’s strategy, and what to do about it. Reflecting on decades of experience supporting administrative efficiency and organizational transformation, EAB has identified three reasons traditional benchmarking falls short and what leaders should do instead.
Why traditional administrative benchmarking falls short
1. Institutional comparisons lack meaning because roles, structures, and spending vary widely
Requests like the one above assume an easily identifiable group of institutions with similar administrative titles and structures. In reality, the only consistent aspect of higher education administrative structures is that each institution is unique. This is the case even when institutions share similar surface-level characteristics like size and sector that are often used when establishing peer groups.
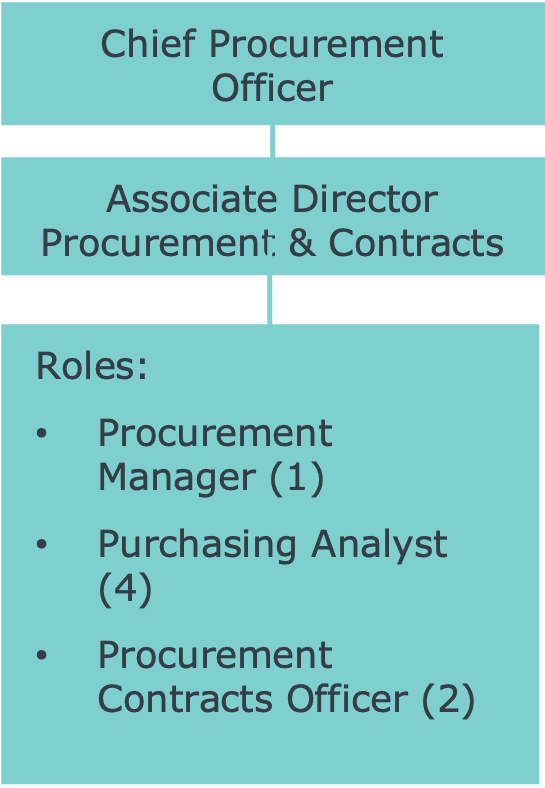
Even with shared characteristics, org chart comparisons are still apples to oranges
Comparison of procurement functions between large public R1s*
Institution A
Public R1 with 38.5K students
Institution B
Public R1 with 35.5K students
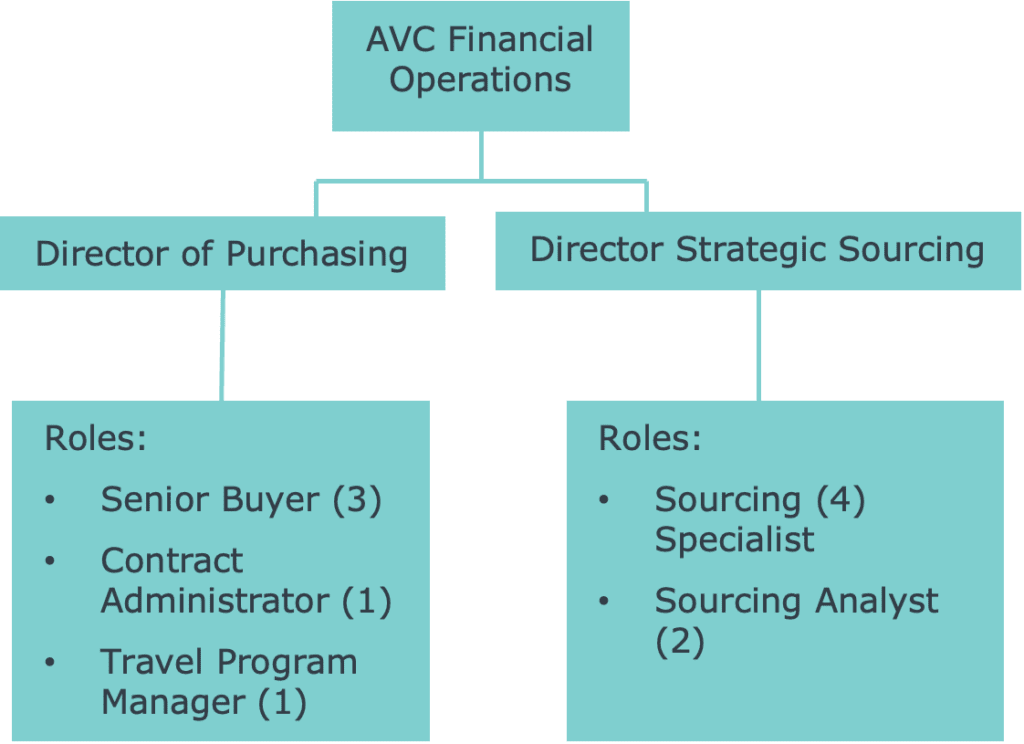
*Figure represents real, anonymized institutions
Comparing the organizational charts above tells leaders more about differences in organizational design choices than productivity gaps. Without knowing how differently titled roles overlap, how much work is handled, and whether staff split time supporting another administrative function, it is not clear which institution handles work more efficiently.
Cost benchmarking also does not directly measure productivity differences. Research shows that institutions with similar administrative budgets vary significantly in how they distribute funds across functions. This reflects that spending is based on institutional choices, not just efficiency. Furthermore, an institution might spend less but outsource key functions, defer compliance work, or shift administrative tasks to faculty and departmental staff. As with role-based analysis, benchmarks lack meaning without deeper knowledge of institutional behavior.
2. Traditional benchmarks show institutions how to look average, not effective
The goal of comparing administrative ratios is to assess efficiency relative to peers, but the midpoint of a benchmark group is a statistical average, not a model of success. Institutions included in that average often struggle with outdated processes, duplicative work, or misaligned service structures.
This is illustrated by results from EAB’s Administrative Effectiveness Index, EAB’s alternative to administrative benchmarks. The index asks campus stakeholders to assess whether their institution meets best-practice criteria across 19 administrative activities. Maturity scores reflect the share of respondents who agree that those standards are met. Across nearly 30 participating institutions, on a scale of 1 (lowest) to 5 (highest), average maturity scores fall below 3 for nearly half of the activities, with consistent weakness in operations and data-related activities.
Five lowest-maturity administrative activities
n=27
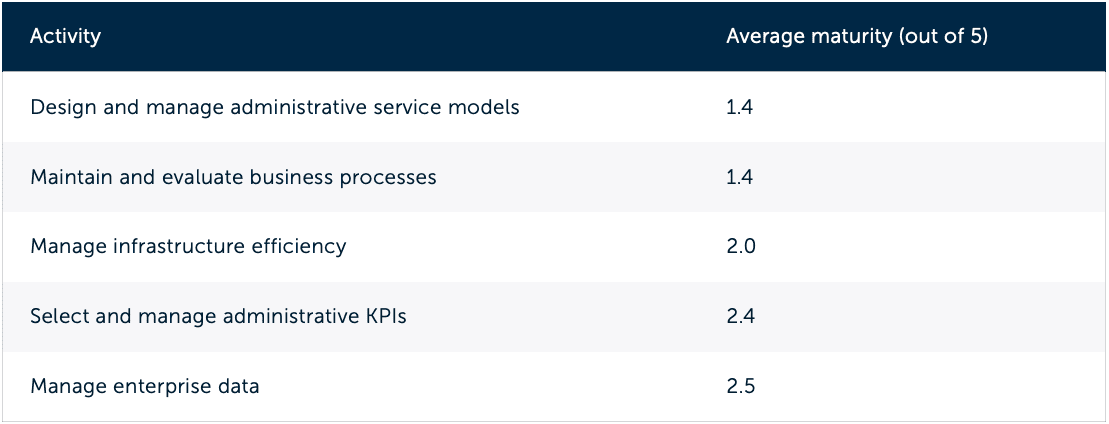
As the table above shows, even if an institution struggles significantly with its administrative service models or business processes, benchmarks are unlikely to flag an efficiency gap because the average institution also has low maturity in those areas. As a result, comparisons to averages miss an opportunity to address many of higher education’s most significant improvement areas.
3. Benchmarking reinforces the status quo and obscures real efficiency opportunities
The problem is not just that benchmarks misidentify gaps. It’s that even when they do identify inefficiencies, they fail to explain to leaders what to do next. EAB partners often report that benchmarking exercises took too long to be useful and ended without any meaningful change on campus. Over a short survey window, for example, we found that five of our partners had recently canceled or were planning to cancel benchmarking services because of concerns about actionability.
Case study: Benchmarking fails to spur next steps at Northbridge University*
Northbridge University learned it spends 10% more on administrative staff than its peers. However, the analysis did not clarify:
- Which functions or processes drive the overspending
- Whether Northbridge’s goals or service levels differ from peers
- Whether a 10% reduction would meaningfully improve efficiency, or whether both Northbridge and its peers are structurally overstaffed
After investing significant time and money in the study, Northbridge lacked clear next steps and was hesitant to commit to additional analysis. Leadership decided to pause administrative efficiency efforts altogether.
*Real, anonymized institution
Rather than generating new insight, benchmarking often reinforces leaders’ existing assumptions. For example, analyses focused narrowly on administrative staffing can validate concerns about administrative growth while overlooking the broader cost structure.
Over half of higher ed labor spending is academic, with 38% to 49% of costs allocated to instruction. But by limiting the scope to administrative labor, benchmarks highlight the perceived issue while leaving the institution’s largest cost drivers unexamined. What remains is an incomplete picture that cannot support meaningful change.
A better way to address strategic goals
Benchmarking requests are often a proxy for broader strategic goals. Before defaulting to traditional benchmarks, EAB recommends clarifying the underlying need and determining whether a better approach exists. We’ve identified three common objectives behind benchmarking requests, along with resources that best support each goal:
1. Pinpoint where administrative effectiveness falls short of best practice
Rather than inferring effectiveness from staffing ratios, the Administrative Effectiveness Index measures administrative maturity directly by surveying stakeholders on best-practice adoption in four categories:
- Operations and data
- Talent management
- Financial management
- Facilities management
The index also assesses how critical each activity is to institutional strategy, enabling EAB to recommend priority improvement areas based on both maturity and importance. This additional layer of analysis gives senior leaders a clear next step, supported by additional resource recommendations.
2. Uncover and prioritize actionable cost-savings opportunities
While traditional administrative benchmarking focuses narrowly on staff, EAB’s Cost Savings Locator evaluates cost containment strategies across 10 major categories, including position control, benefits, and procurement. A custom report and EAB expert debrief identify untapped opportunities and help institutions prioritize efforts based on savings potential and institutional context.
3. Launch an organizational transformation to improve administrative efficiency
Most institutions interested in benchmarking already know that changes are needed on campus. But transformational change requires intentional focus on people, processes, and culture. EAB’s Organizational Transformation Resource Center helps college and university leaders get started with case studies from institutions around the world that have completed major administrative redesigns, highlighting how they tailored implementation strategies to their unique institutional cultures.
Interested in learning more?
If you are not a Strategic Advisory Services partner and would like to learn how EAB can help support operational efficiency on campus, fill out the form with your information and we’ll follow up.

More Blogs

Why higher ed administrative transformation stalls at scale

How CBOs can prepare for higher ed’s less stable future