What happens when you disaggregate your student success data?
A case study on data and equity conversations at Carthage College
July 19, 2022
Untold campus insights are hiding in plain sight within our student success data. When leaders disaggregate data for a group, their needs become visible. This makes it possible to prioritize the allocation of resources and create policy change. A great example of this is early alert data. By analyzing disaggregated early alert data, we can determine if faculty, advisor, and staff outreach and support practices are equitable across different populations.
The conversations that result from an analysis like this can be both challenging and beneficial. Understandably, many of our colleagues remain unsure of their role in promoting student equity. With detailed data we can enable more staff to engage, share thoughts, and move towards personal responsibility and action for eliminating equity gaps.
In this post I’ll discuss what it means to disaggregate data, and why access to this data remains limited. I’ll then offer a case study from Carthage College, a private, religious institution in a city recently thrust into the national conversation on race.
What does it mean to disaggregate data?
Disaggregation means breaking down data into smaller, specific, and meaningful subgroups. To ensure an accurate snapshot of institutional barriers, campus leaders must select metrics that represent the entirety of their student population without lumping distinct subgroups together (e.g., “underrepresented minority” and “students of color” are too broad for leaders to gain meaningful insight from their data).
Common subgroups our Navigate and Starfish partners use to disaggregate data include:
|
Gender Race/ethnicity Disability Pell-eligible ESL |
Foster youth Homelessness Military Migrant Student-parent |
Age Rural Sexual orientation First-generation status Religion |
Student type Class/major Commuter status Attendance status Resident status |
While most college campuses have data on the metrics needed for federal reporting, those metrics don’t paint the full picture of students. And even given the data institutions do have, not enough are disaggregating the data, and even fewer are interrogating it. In our interviews with success leaders, frequently cited hurdles to this work include lack of institutional mandate or capacity, criticism of the data itself, concern around its use, and fear of what the data will reveal.
Case study: Carthage College
What early alert data revealed about Carthage
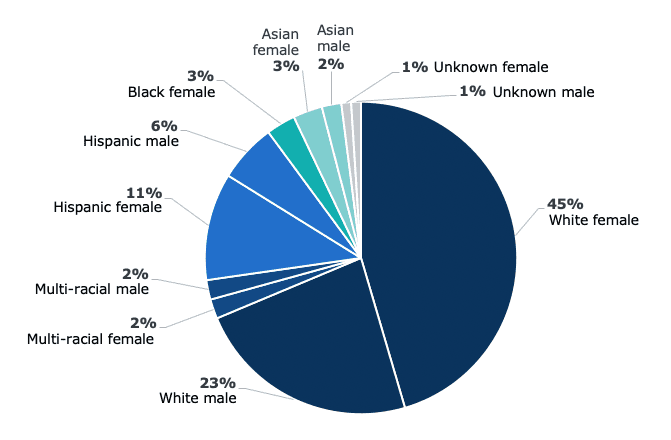
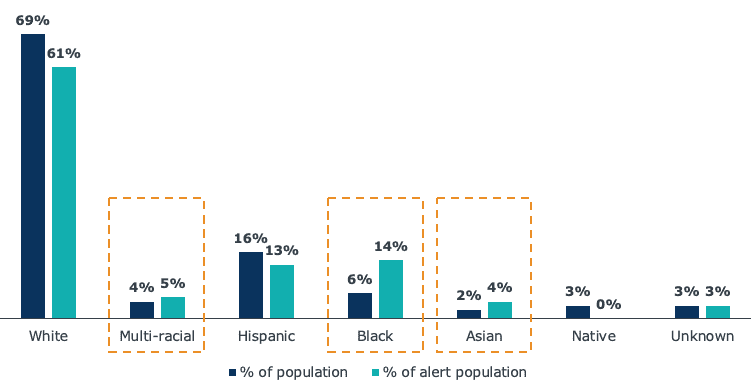
Carthage College’s Data-Centered and Coordinated Care Team disaggregated the College’s early alert data for the first time last fall. After an initial pilot of their early alert program in Fall 2021, the college underwent an equity audit. The findings raised more questions than answers. White female students received more positive “high-five” alerts than males and students of color. A disproportionate number of students of color (Black, Latinx, and Native) received more negative alerts related to attendance than their White peers. Why?
Students who received “high-five” alerts by race and gender*

*Carthage currently only collects gender as either male or female.
Share of population that received an excessive absence alert, Fall 2021
14% of alerts were raised on Black students, who represent only 6% of the population. Asian and multi-racial students also received a disproportionately high share of alerts.

Structured conversation moves the team from data to institutional and individual action
To ensure campus colleagues could engage in meaningful discussions about what they found, Melissa Burwell, Executive Director of Student Success, convened cross-departmental colleagues for a data conversation. They talked about what the data revealed in how they support students across race and gender, as well as first-generation status, class year, and athlete status.
As part of that meeting, participants were put into breakout groups to discuss the findings. The groups engaged in “equity-minded sensemaking,” a term coined by racial equity scholar Dr. Estella Bensimon, to understand what potential practices may contribute to why specific student groups are flagged more frequently across a semester.
Melissa and her team posed the following open-ended questions, adapted from the book, Equity Walk, Equity Talk, inviting participants to interrogate the state of racial equity at Carthage College and to offer solutions:
- What patterns do you notice in the data?
- Which groups are experiencing inequities? Based on what we know now (through individual and institutional work), what recommendations do you have for future action?
- Is there a question or data point you want to know more about? How would that help us identify interventions or support? How would we use it?
- How does this data inform our student support and interventions to increase retention?
- What rises to the top? What can we do to make an impact now? Where do we want to start?
This framework moved the conversation from data analysis to questioning and addressing institutional and individual practices and processes. As Melissa says, “These conversations help you and others understand the data, see what barriers exist, and then move towards what we can do together and as individuals within our work.
-
What is equity-minded sensemaking?
Coined by leadership at the Center of Urban Education, it describes the process of critical reflection, contextualization, and meaning-making that involves interpreting equity gaps as a a signal that practices are not working as intended. This skill is critical in guiding discussions of data disaggregated by race and ethnicity as it allows the pursuit of answers through practitioner inquiry, or study of one’s own practices, with insights gained in the process acting as a guide for institutional action and change.
Results
High-five alerts (positive)
- Limited use for academic performance only, to avoid ambiguity
- Expanded number of alerts from one to three to reward students engaged in class and showing improvement
- Increased the diversity of courses participating in the pilot (previously skewed towards education and social work, which are disproportionately female and White)
They hope these slight tweaks might offset their initial findings and improve the possibility that a positive alert could lessen the blow of a negative one.
Attendance alerts (negative)
- Excessive absence alert is available for use after the add/drop deadline
By making that alert available only after the add/drop deadline, the Carthage team hopes they gain a better sense of which students are struggling to get to class. However, several questions remain: Are students more likely to be flagged because they physically stand out when not in attendance? Are absences across race flagged at the same rate? The investigation into early alert practices continues at the College.
The Carthage team is currently pulling together their report for the academic year. We’ll continue to share their progress in the coming months.
Learn More: Check Out EAB’s Inclusion and Belonging Resource Center
Disaggregating data helps ensure our intentions match our impact
The work of the Carthage team demonstrates the importance of disaggregating and investigating our early alert data (and other student data) regularly to ensure our intentions match our impact. Creating the conditions for equity requires the whole campus community to embody the ability to continually learn and question long-held assumptions about students, ourselves, and campus practices and policies. By sharing and talking about our student support data, we can disrupt unchecked biases and create tailored experiences for students that enable them to succeed.
More Blogs

How to navigate policy challenges and show support for your trans students

Our LGBTQ students’ lives and wellbeing are at risk—here are 5 things campus leaders can do to help
