Coronavirus Outbreak’s Impacts on U.S. Employer Demand
As the novel coronavirus entered and spread within the United States in early 2020, stay-at-home orders immobilized economic activity. Hiring freezes, furloughs, and layoffs defined the summer months. EAB has continued to monitor regional and nationwide labor market data to inform your program planning conversations. Use these analyses and the included discussion questions to consider how to adapt your portfolio for COVID-19 and the pandemic economic recovery.
A job postings analysis and discussion guide
Consider this early data in your portfolio planning conversations, as well as the recommended questions for discussion. Use the menu on the left to navigate to geographical data.
U.S. national data
Changes in job postings volume
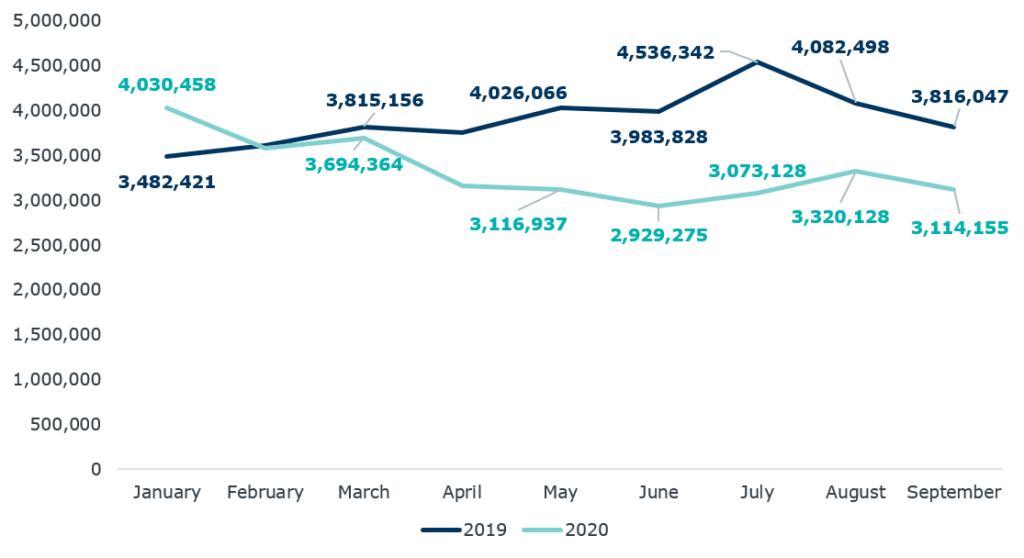
Questions for initial discussion:
- How did the United States economy react to the coronavirus outbreak across April through September? Has the nationwide public health and economic response been consistent, or have we experienced improvements and declines throughout?
- How do our recent job posting trends contrast to this time last year? To what extent do we see this reflected in our students’ behaviors?
-31%
Decline in postings from April-September 2019 to April-September 2020
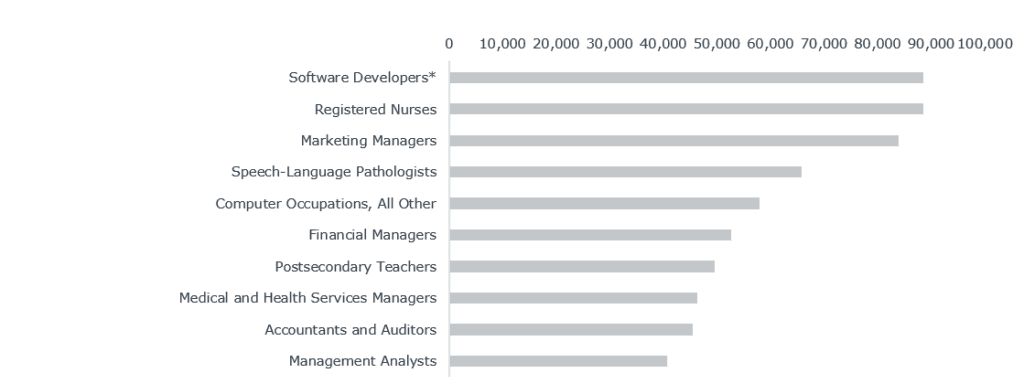
Changes in top occupations advertised regionally in April-September 2018, 2019, 2020
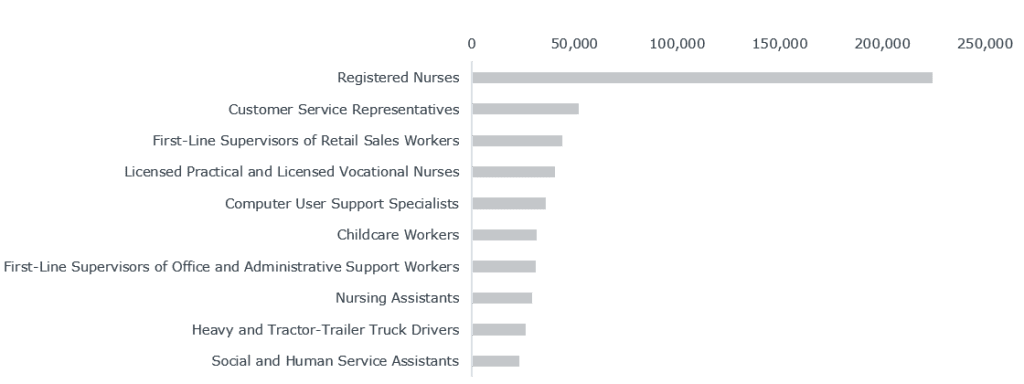
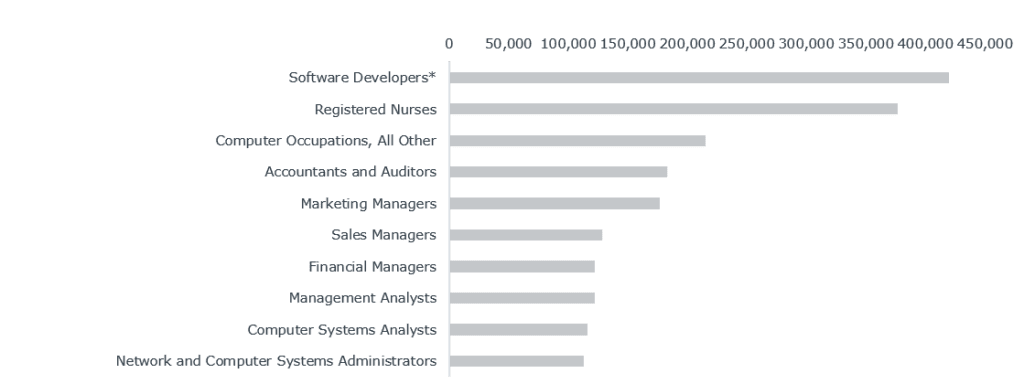
Top occupations
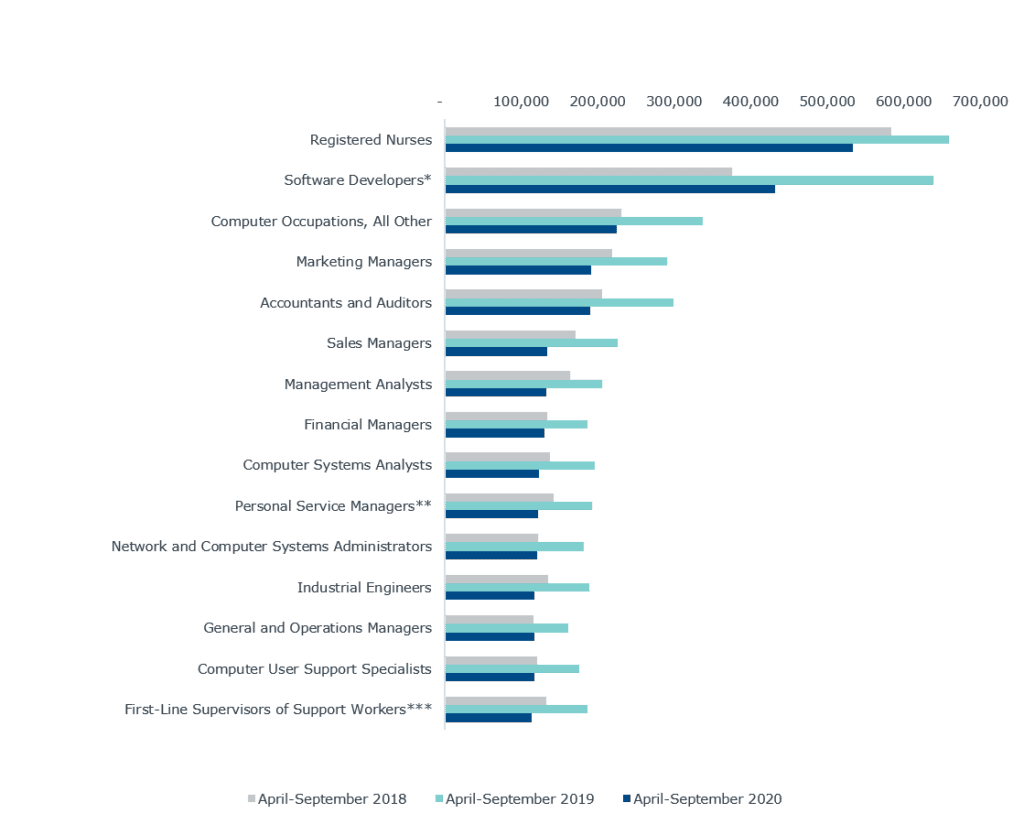
Top occupations for associate-level professionals
Top occupations for bachelor’s-level professionals
Top occupations for advanced degree professionals
Questions for initial discussion:
- Which roles experienced increased demand in 2020 relative to 2019 and 2018? To what extent would past trends encourage us to anticipate a sustained increase? Or, do we anticipate the increase was driven by the outbreak and may decline once short-term needs are met?
- Do we offer programs to prepare students for in-demand roles?
- Which roles experienced decreased demand in 2020 relative to 2019 and 2018? Would industry projections as we recover from the coronavirus outbreak suggest future growth or continued decline for these roles?
- Should we temper expectations for relevant program enrollment?
- Is it likely these roles also suffered layoffs immediately following the initial outbreak? Do we likely have alumni or community members who need re-training for reemployment?
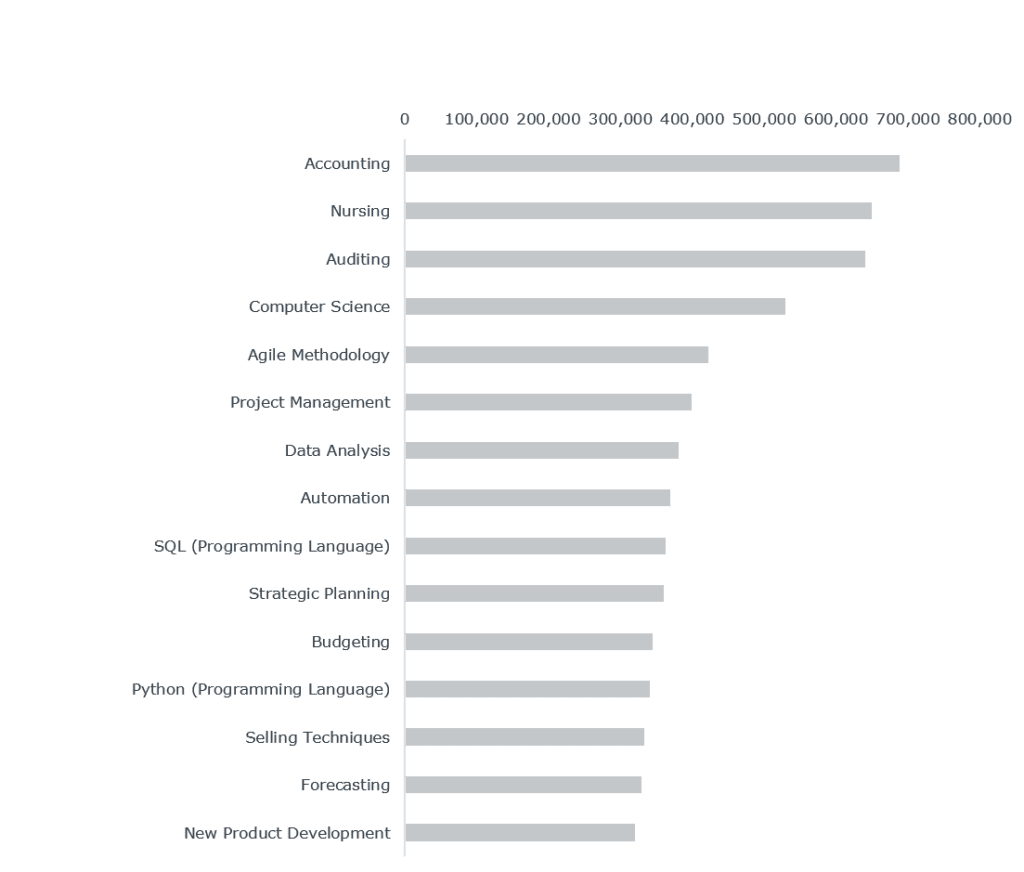
Top skills sought regionally after the U.S. coronavirus outbreak
Top skills sought
Questions for initial discussion:
- Which skills are in greatest demand as the coronavirus outbreak continues? Do we expect these trends to hold?
- Are we teaching in-demand skills? Can prospective students easily identify which programs teach these skills? Do employers recognize which of our programs develop these in-demand skills?
Changes in skills sought regionally before and after the U.S. coronavirus outbreak
Fastest-growing skills from April-September 2019 to April-September 2020
National data, April-September 2020
| Skill | Number of Job Postings, April-Sept. 2019 | Proportion of All Job Postings April-Sept. 2019 | Number of Job Postings, April-Sept. 2020 | Proportion of All Job Postings April-Sept. 2020 | Percent Change |
| Scalability | 241,189 | 2.12% | 194,103 | 2.47% | 8.55% |
| Business Requirements | 295,419 | 2.60% | 194,132 | 2.47% | 8.21% |
| Version Control | 106,645 | 0.94% | 76,295 | 0.97% | 7.47% |
| Home Care | 89,061 | 0.78% | 76,085 | 0.97% | 7.41% |
| Jenkins | 100,576 | 0.89% | 76,101 | 0.97% | 7.40% |
| Psychology | 224,244 | 1.97% | 185,446 | 2.36% | 7.37% |
| Long-Term Care | 88,810 | 0.78% | 75,920 | 0.97% | 7.35% |
| Associates Degree in Nursing | 100,192 | 0.88% | 75,528 | 0.96% | 7.03% |
| Business Model | 102,750 | 0.90% | 75,457 | 0.96% | 7.01% |
| Medical Devices | 102,130 | 0.90% | 75,040 | 0.96% | 6.86% |
| Primary Care | 84,582 | 0.74% | 76,298 | 0.97% | 6.84% |
| Software Systems | 123,948 | 1.09% | 71,405 | 0.91% | 6.76% |
| Emerging Technologies | 126,233 | 1.11% | 70,698 | 0.90% | 6.73% |
| Medicaid | 109,290 | 0.96% | 72,496 | 0.92% | 6.73% |
| Microservices | 86,886 | 0.77% | 71,147 | 0.91% | 6.70% |
Questions for initial discussion:
- To what extent do we anticipate demand for these emerging skills to continue growing, or to sustain at these higher levels, in the future?
- Are we teaching emerging skills that experienced significant growth compared to demand earlier this year? If so, have we experienced increased interest/applications/enrollments in relevant programs? If not, how can we better communicate to prospective students that these offerings instill emerging skills?
Industries’ employer demand before and after the U.S. coronavirus outbreak
Job postings by industry in April-September 2019 and April-September 2020
National data, April-September 2020
| Industry | Number of Job Postings, April-Sept. 2019 | Proportion of All Job Postings, April-Sept. 2019 | Number of Job Postings, April-Sept. 2020 | Proportion of All Job Postings, April-Sept. 2020 | Percentage Point Change |
| Public Administration | 288,446 | 2.54% | 260,983 | 3.33% | 30.95% |
| Retail Trade | 689,965 | 6.08% | 524,606 | 6.69% | 10.04% |
| Utilities | 55,168 | 0.49% | 41,991 | 0.54% | 4.86% |
| Health Care and Social Assistance | 1,415,834 | 12.47% | 990,454 | 12.62% | 1.25% |
| Information | 638,694 | 5.62% | 458,376 | 5.84% | -0.45% |
| Transportation and Warehousing | 156,146 | 1.37% | 117,388 | 1.50% | -2.22% |
| Accommodation and Food Services | 248,659 | 2.19% | 144,837 | 1.85% | -3.72% |
| Manufacturing | 1,149,607 | 10.12% | 750,018 | 9.56% | -5.58% |
| Real Estate and Rental and Leasing | 173,746 | 1.53% | 100,459 | 1.28% | -6.89% |
| Administrative and Support and Waste Management and Remediation Services | 1,740,591 | 15.33% | 1,117,559 | 14.24% | -7.08% |
| Educational Services | 666,408 | 5.87% | 400,331 | 5.10% | -9.28% |
| Construction | 209,058 | 1.84% | 134,087 | 1.71% | -10.78% |
| Professional, Scientific, and Technical Services | 1,920,499 | 16.91% | 1,163,608 | 14.83% | -12.31% |
| Arts, Entertainment, and Recreation | 57,956 | 0.51% | 33,259 | 0.42% | -12.75% |
| Wholesale Trade | 217,520 | 1.92% | 122,769 | 1.56% | -15.01% |
| Other Services (except Public Administration) | 217,714 | 1.92% | 145,903 | 1.86% | -15.08% |
| Agriculture, Forestry, Fishing, and Hunting | 27,033 | 0.24% | 15,363 | 0.20% | -17.75% |
| Finance and Insurance | 934,223 | 8.23% | 528,357 | 6.73% | -18.15% |
| Management of Companies and Enterprises | 42,288 | 0.37% | 22,570 | 0.29% | -22.75% |
| Mining, Quarrying, and Oil and Gas Extraction | 23,913 | 0.21% | 12,350 | 0.16% | -25.25% |
Questions for initial discussion:
- How did our local and nationwide industry demand shift during the coronavirus outbreak?
- Which industries suffered the most, as demonstrated by the greatest decline in job postings?
- To what extent do we suspect alumni already employed in hard-hit fields may lose their employment and need re-training to secure available jobs?
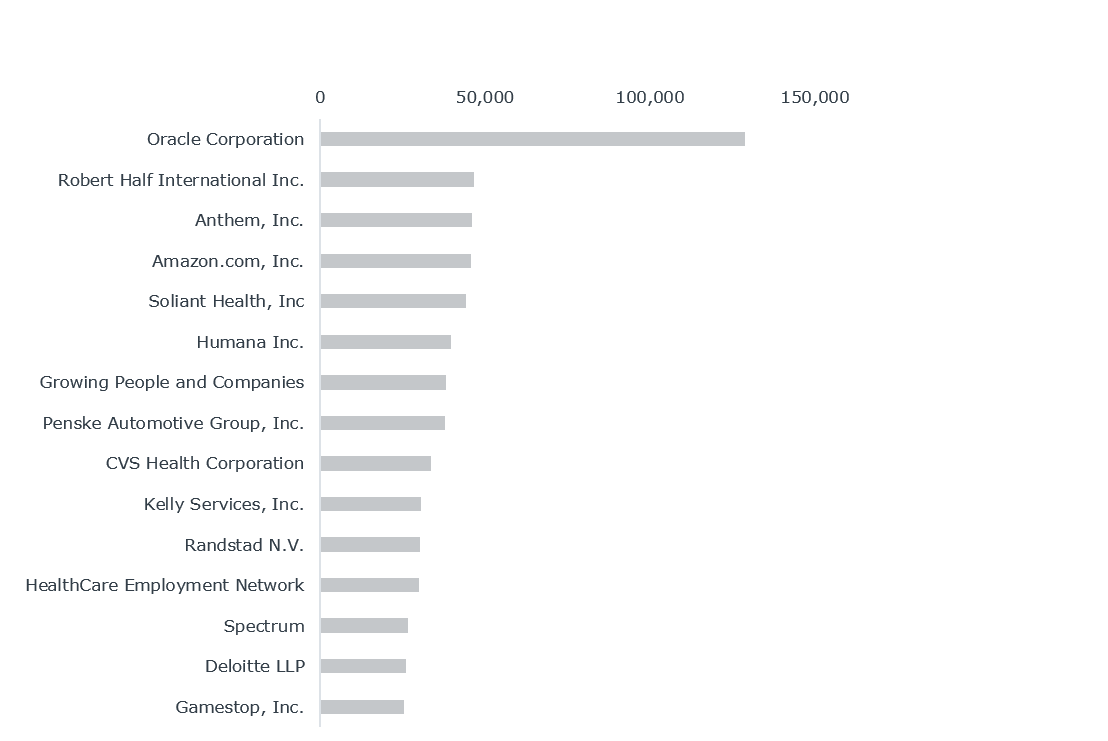
Top hiring employers after the U.S. coronavirus outbreak
Top hiring employers
Questions for initial discussion:
- Do we partner with any of these employers with the highest demand in recent months?
U.S. by region, Northeast
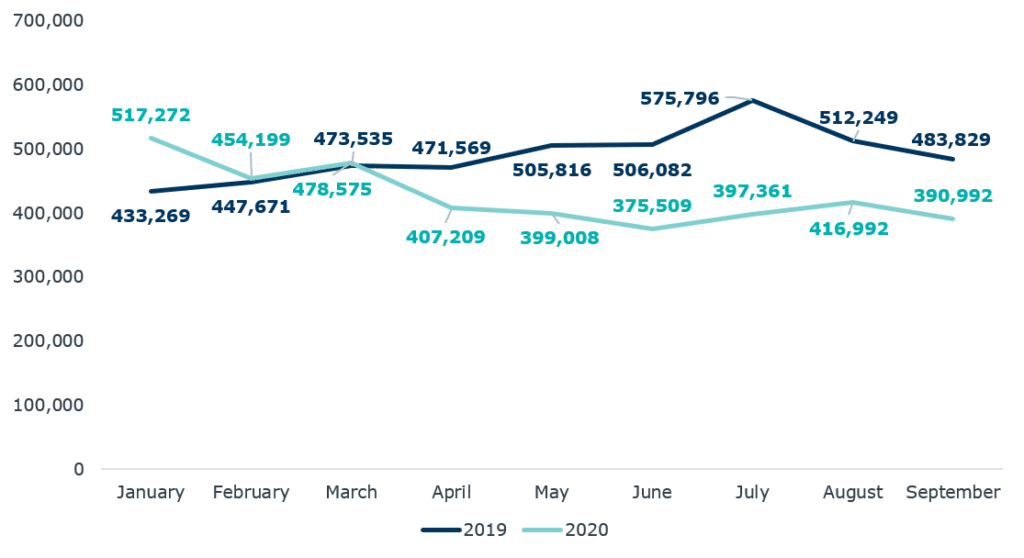
Changes in job postings volume
Questions for initial discussion:
- How did our regional economy react to the coronavirus outbreak across April through September? Has our regional public health and economic response been consistent, or have we experienced improvements and declines throughout?
- How do our recent job posting trends contrast to this time last year? To what extent do we see this reflected in our students’ behaviors?
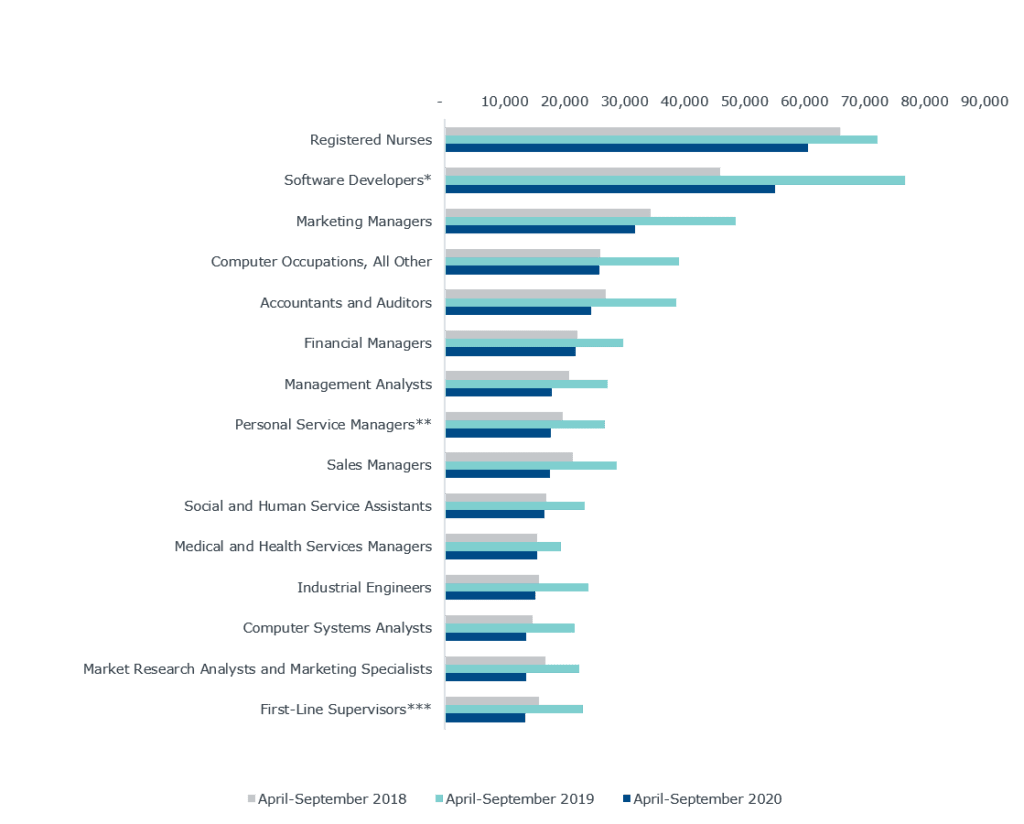
Changes in top occupations advertised regionally in 2018, 2019, and 2020
Top occupations
Top occupations for associate-level professionals

Top occupations for bachelor’s-level professionals

Top occupations for advanced degree professionals

Questions for initial discussion:
- Which roles, if any, experienced increased demand in 2020 relative to 2019 and 2018? To what extent would past trends encourage us to anticipate a sustained increase? Or, do we anticipate the increase was driven by the outbreak and may decline once short-term needs are met?
- Do we offer programs to prepare students for in-demand roles?
- Which roles experienced decreased demand in 2020 relative to 2019 and 2018? Would industry projections as we recover from the coronavirus outbreak suggest future growth or continued decline for these roles?
- Should we temper expectations for relevant program enrollment?
- Is it likely these roles also suffered layoffs immediately following the initial outbreak? Do we likely have alumni or community members who need re-training for reemployment?
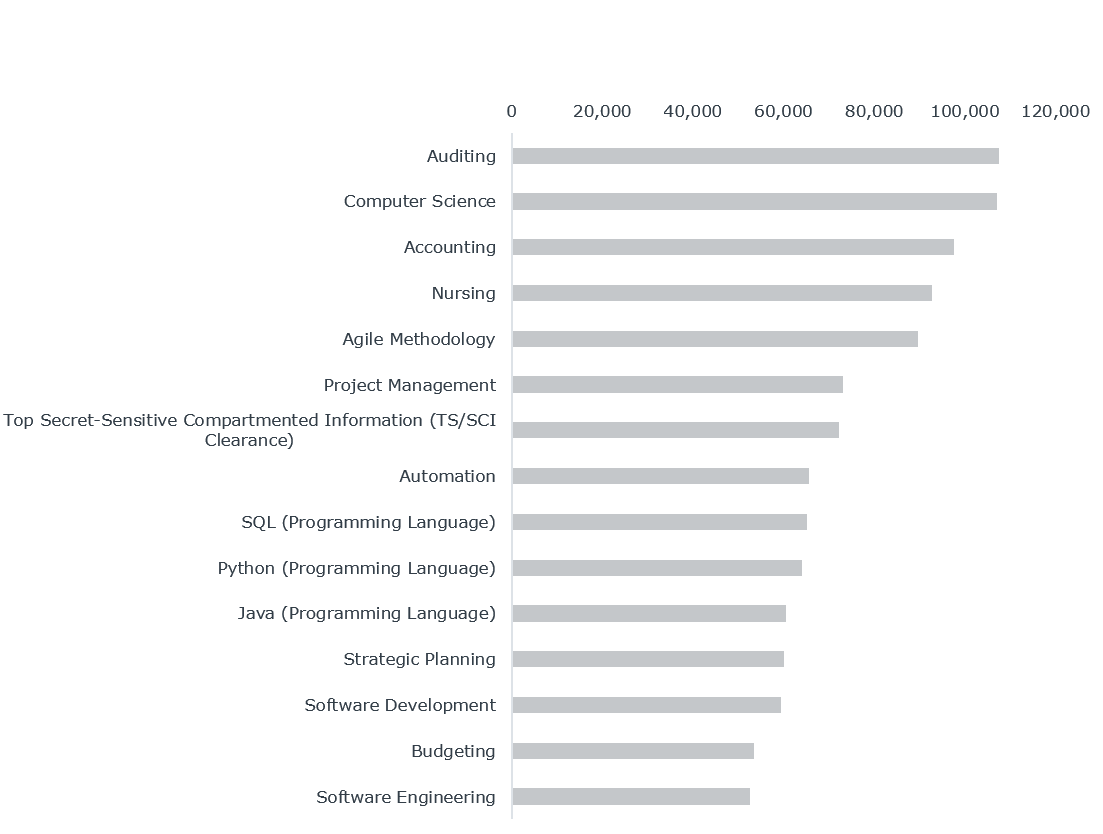
Top skills sought regionally after the U.S. coronavirus outbreak
Top skills sought
Questions for initial discussion:
- Which skills are in greatest demand as the coronavirus outbreak continues? Do we expect these trends to hold?
- Are we teaching in-demand skills? Can prospective students easily identify which programs teach these skills? Do employers recognize which of our programs develop these in-demand skills?
Changes in skills sought regionally before and during the U.S. coronavirus outbreak
Skills with highest relative growth, April-September 2020 relative to April-September 2019
Northeast regional data, April to September 2020
| Skill | Number of Job Postings, April-Sept. 2019 | Proportion of All Job Postings April-Sept. 2019 | Number of Job Postings, April-Sept. 2020 | Proportion of All Job Postings, April-Sept. 2020 | Percentage Growth |
| Economics | 35,265 | 2.49% | 26,112 | 2.67% | 11.18% |
| Procurement | 31,189 | 2.20% | 23,376 | 2.39% | 10.59% |
| Financial Statements | 45,739 | 3.22% | 32,309 | 3.31% | 10.35% |
| Operating Systems | 30,646 | 2.16% | 22,773 | 2.33% | 10.26% |
| Application Programming Interface (API) | 28,905 | 2.04% | 22,327 | 2.29% | 10.14% |
| Computer Engineering | 19,175 | 1.35% | 14,220 | 1.46% | 9.87% |
| Business Requirements | 35,809 | 2.52% | 25,027 | 2.56% | 9.86% |
| Customer Satisfaction | 40,026 | 2.82% | 26,194 | 2.68% | 9.81% |
| Merchandising | 34,106 | 2.40% | 21,787 | 2.23% | 9.52% |
| Language Translation | 16,192 | 1.14% | 14,278 | 1.46% | 9.51% |
| Workflows | 32,439 | 2.29% | 23,004 | 2.36% | 9.47% |
| Linux | 34,044 | 2.40% | 25,070 | 2.57% | 9.43% |
| Psychology | 27,708 | 1.95% | 23,206 | 2.37% | 9.40% |
| Advising | 18,414 | 1.30% | 14,106 | 1.44% | 9.33% |
| Customer Experience | 32,865 | 2.32% | 25,653 | 2.63% | 9.29% |
Questions for initial discussion:
- To what extent do we anticipate demand for these emerging skills to continue growing, or to sustain at these higher levels, in the future?
- Are we teaching emerging skills that experienced significant growth compared to demand earlier this year? If so, have we experienced increased interest/applications/enrollments in relevant programs? If not, how can we better communicate to prospective students that these offerings instill emerging skills?
Industries’ employer demand before and after the U.S. coronavirus outbreak
Job postings by industry, April-September 2020 relative to April-September 2019
Northeast regional data, April-September 2020
| Industry | Number of Job Postings, January-February 2020 | Proportion of All Job Postings, January-February 2020 | Number of Job Postings, April-September 2020 | Proportion of All Job Postings, April-September 2020 | Percentage Point Change |
| Other Services (except Public Administration) | 32,678 | 2.30% | 21,895 | 2.24% | 12.30% |
| Public Administration | 23,329 | 2.00% | 23,893 | 2.45% | 6.24% |
| Health Care and Social Assistance | 179,770 | 12.67% | 128,265 | 13.14% | 3.67% |
| Educational Services | 102,275 | 7.21% | 55,365 | 5.67% | 1.87% |
| Retail Trade | 78.968 | 5.57% | 58,236 | 5.96% | -1.13% |
| Manufacturing | 141,012 | 9.94% | 88,526 | 9.07% | -8.78% |
| Information | 85,587 | 6.03% | 63,606 | 6.51% | -9.63% |
| Management of Companies and Enterprises | 5,535 | 0.39% | 3,427 | 0.35% | -10.04% |
| Wholesale Trade | 21,628 | 1.52% | 13,370 | 1.37% | -10.18% |
| Construction | 18,836 | 1.33% | 12,371 | 1.27% | -10.57% |
| Finance and Insurance | 132,720 | 9.36% | 81,148 | 8.31% | -11.16% |
| Professional, Scientific, and Technical Services | 228,999 | 16.14% | 139,060 | 14.24% | -11.76% |
| Utilities | 8,715 | 0.61% | 5,788 | 0.59% | -11.93% |
| Administrative and Support and Waste Management and Remediation Services | 223,682 | 15.77% | 135,130 | 13.84% | -12.22% |
| Transportation and Warehousing | 11,803 | 0.83% | 6,938 | 0.71% | -14,59% |
| Arts, Entertainment, and Recreation | 9.549 | 0.67% | 5,076 | 0.52% | -15.37% |
| Real Estate and Rental and Leasing | 20,100 | 1.42% | 10,639 | 1.09% | -17.93% |
| Accommodation and Food Services | 24,784 | 1.75% | 13,794 | 1.41%% | -19.13% |
| Mining, Quarrying, and Oil and Gas Extraction | 934 | 0.07% | 510 | 0.05% | -20.66% |
| Agriculture, Forestry, Fishing and Hunting | 2,086 | 0.15% | 936 | 0.10% | -23.80% |
Questions for initial discussion:
- How did our local industry demand shift during the coronavirus outbreak?
- Which industries suffered the most, as demonstrated by the greatest decline in job postings?
- To what extent do we suspect alumni already employed in hard-hit fields may lose their employment and need re-training to secure available jobs?
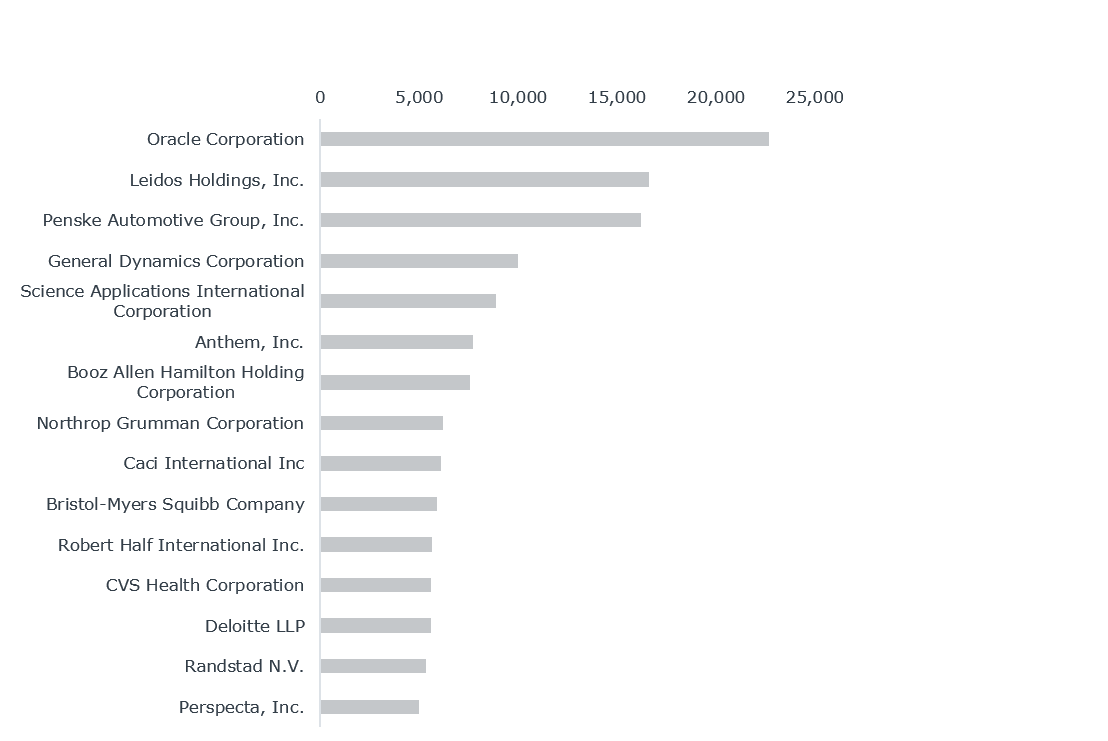
Top hiring employers after the U.S. coronavirus outbreak
Top hiring employers
Questions for initial discussion:
- Do we partner with any of these employers with the highest demand in recent months?
U.S. by region, Mid-Atlantic
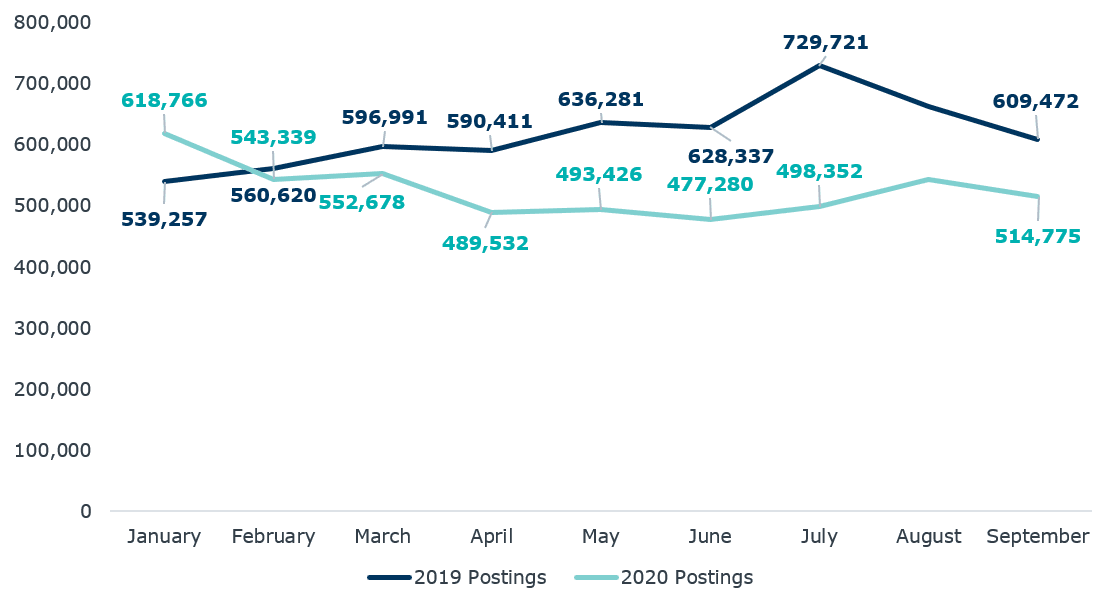
Changes in job postings volume
Questions for initial discussion:
- How did our regional economy react to the coronavirus outbreak across April through September? Has our regional public health and economic response been consistent, or have we experienced improvements and declines throughout?
- How do our recent job posting trends contrast to this time last year? To what extent do we see this reflected in our students’ behaviors?
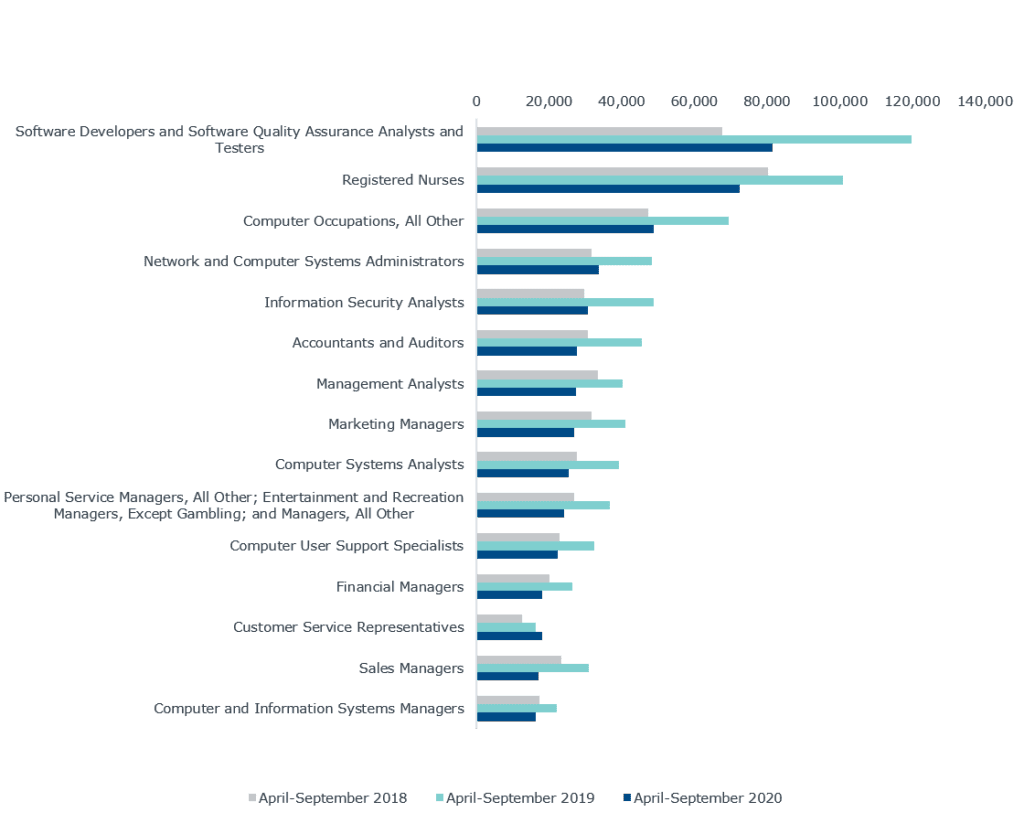
Changes in top occupations advertised regionally in 2018, 2019, and 2020
Top occupations
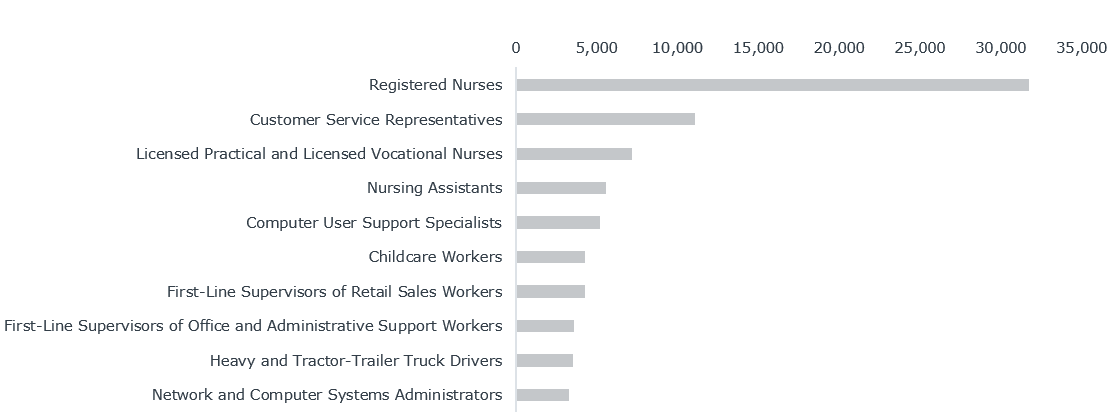
Top occupations for associate-level professionals
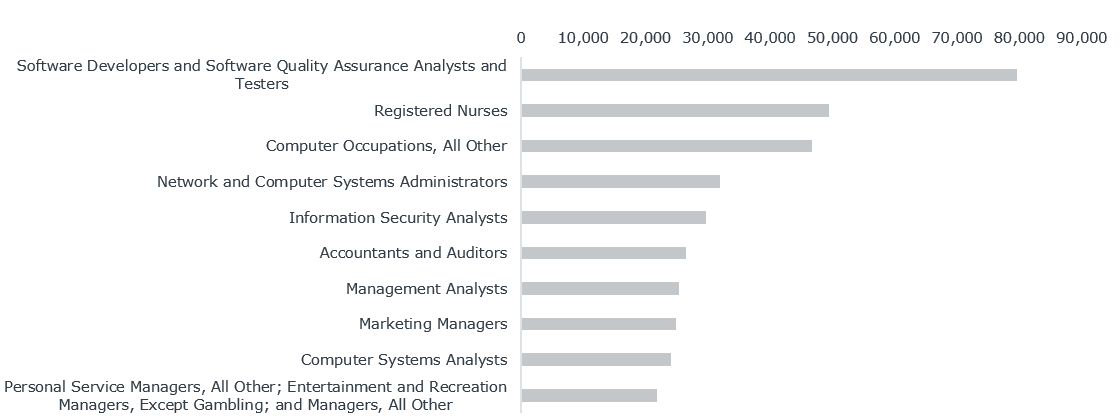
Top occupations for bachelor’s-level professionals
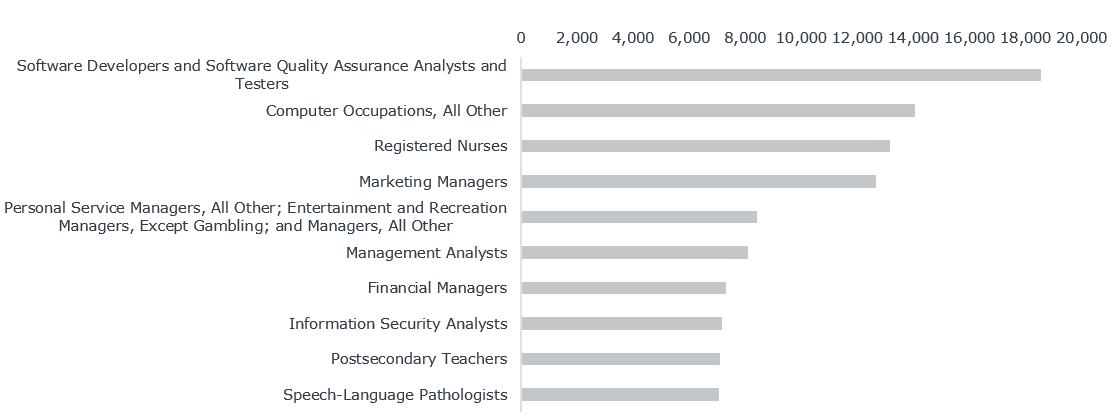
Top occupations for advanced degree professionals
Questions for initial discussion:
- Which roles experienced increased demand in 2020 relative to 2019 and 2018? To what extent would past trends encourage us to anticipate a sustained increase? Or, do we anticipate the increase was driven by the outbreak and may decline once short-term needs are met?
- Do we offer programs to prepare students for in-demand roles?
- Which roles experienced decreased demand in 2020 relative to 2019 and 2018? Would industry projections as we recover from the coronavirus outbreak suggest future growth or continued decline for these roles?
- Should we temper expectations for relevant program enrollment?
- Is it likely these roles also suffered layoffs immediately following the initial outbreak? Do we likely have alumni or community members who need re-training for reemployment?
Top skills sought regionally after the U.S. coronavirus outbreak
Top skills sought

Questions for initial discussion:
- Which skills are in greatest demand as the coronavirus outbreak continues? Do we expect these trends to hold?
- Are we teaching in-demand skills? Can prospective students easily identify which programs teach these skills? Do employers recognize which of our programs develop these in-demand skills?
Changes in skills sought regionally before and after the U.S. coronavirus outbreak
Skills with highest relative growth, April-September 2020 relative to April-September 2019
Mid-Atlantic regional data, April-September 2020
| Skill | Number of Job Postings, April-Sept. 2019 | Proportion of All Job Postings April-Sept. 2019 | Number of Job Postings, April-Sept. 2020 | Proportion of All Job Postings April-Sept. 2020 | Percent Change |
| Nursing | 123,543 | 6.76% | 92,666 | 7.40% | 9.39% |
| Customer Satisfaction | 52,620 | 2.88% | 35,506 | 2.83% | 8.62% |
| Windows PowerShell | 15,638 | 0.86% | 11,070 | 0.88% | 8.33% |
| Bash (Scripting Language) | 13,885 | 0.76% | 11,079 | 0.88% | 8.33% |
| Technical Services | 10,486 | 0.57% | 8,764 | 0.70% | 8.21% |
| Financial Data | 12,934 | 0.71% | 8,747 | 0.70% | 8.01% |
| Corrective and Preventative Action (CAPA) | 48,277 | 2.64% | 35,747 | 2.85% | 7.99% |
| Caregiving | 10,693 | 0.59% | 8,786 | 0.70% | 7.73% |
| Software Documentation | 13,518 | 0.74% | 8,711 | 0.70% | 7.65% |
| Quality Control | 42,611 | 2.33% | 33,393 | 2.67% | 7.63% |
| Surgery | 15,132 | 0.83% | 11,319 | 0.90% | 7.60% |
| Due Diligence | 14,097 | 0.77% | 8,768 | 0.70% | 7.58% |
| Computer Networks | 15,539 | 0.85% | 11,170 | 0.89% | 7.53% |
| Ansible | 15,264 | 0.84% | 11,256 | 0.90% | 7.37% |
| Critical Care | 10,807 | 0.59% | 8,787 | 0.70% | 7.33% |
Questions for initial discussion:
- To what extent do we anticipate demand for these emerging skills to continue growing, or to sustain at these higher levels, in the future?
- Are we teaching emerging skills that experienced significant growth compared to demand earlier this year? If so, have we experienced increased interest/applications/enrollments in relevant programs? If not, how can we better communicate to prospective students that these offerings instill emerging skills?
Industries’ employer demand before and after the U.S. coronavirus outbreak
Job postings by industry, April-September 2020 relative to April-September 2019
Mid-Atlantic regional data, April-September 2020
| Industry | Number of Job Postings, April-Sept. 2019 | Proportion of All Job Postings, April-Sept. 2019 | Number of Job Postings, April-Sept. 2020 | Proportion of All Job Postings, April-Sept. 2020 | Percentage Point Change |
| Public Administration | 40,706 | 2.23% | 35,968 | 2.87% | 28.87% |
| Utilities | 8,805 | 0.48% | 6,825 | 0.54% | 13.05% |
| Manufacturing | 159,412 | 8.73% | 111,193 | 8.88% | 1.73% |
| Finance and Insurance | 139,344 | 7.63% | 74,107 | 5.92% | 0.81% |
| Other Services (except Public Administration) | 34,814 | 1.91% | 23,055 | 1.84% | -3.42% |
| Health Care and Social Assistance | 207,423 | 11.35% | 136,265 | 10.88% | -4.19 |
| Agriculture, Forestry, Fishing, and Hunting | 2,770 | 0.15% | 1,786 | 0.14% | -5.97% |
| Information | 101,537 | 5.56% | 65,460 | 5.23% | -5.98% |
| Real Estate and Rental and Leasing | 23,674 | 1.30% | 14,021 | 1.12% | -6.06% |
| Accommodation and Food Services | 33,449 | 1.83% | 20,017 | 1.60% | -7.04% |
| Administrative and Support and Waste Management and Remediation Services | 268,556 | 14.70% | 169,554 | 13.54% | -7.92% |
| Professional, Scientific, and Technical Services | 434,651 | 23.79% | 273,323 | 21.82% | -8.29% |
| Wholesale Trade | 27,532 | 1.51% | 14,877 | 1.19% | -8.35% |
| Construction | 31,404 | 1.72% | 20,452 | 1.63% | -10.83% |
| Educational Services | 107,214 | 5.87% | 60,360 | 4.82% | -10.85 |
| Mining, Quarrying, and Oil and Gas Extraction | 2,292 | 0.13% | 1,381 | 0.11% | -12.13% |
| Transportation and Warehousing | 21,768 | 1.19% | 16,355 | 1.31% | –13.45% |
| Retail Trade | 98,738 | 5.40% | 82,143 | 6.56% | -14.03% |
| Arts, Entertainment, and Recreation | 6,777 | 0.37% | 3,887 | 0.31% | -16.35 |
| Management of Companies and Enterprises | 7,988 | 0.44% | 4,000 | 0.32% | -26.97% |
Questions for initial discussion:
- How did our local industry demand shift during the coronavirus outbreak?
- Which industries suffered the most, as demonstrated by the greatest decline in job postings?
- To what extent do we suspect alumni already employed in hard-hit fields may lose their employment and need re-training to secure available jobs?
Top hiring employers after the U.S. coronavirus outbreak
Top hiring employers

Questions for initial discussion:
- Do we partner with any of these employers with the highest demand in recent months?
U.S. by region, South
Changes in job postings volume
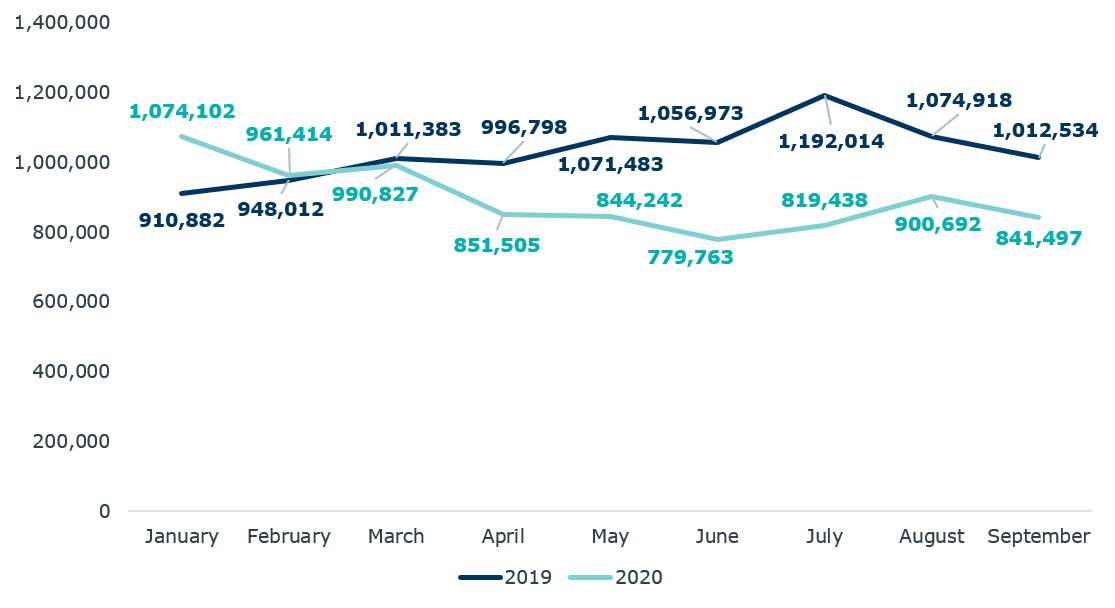
Questions for initial discussion:
- How did our regional economy react to the coronavirus outbreak across April through September? Has our regional public health and economic response been consistent, or have we experienced improvements and declines throughout?
- How do our recent job posting trends contrast to this time last year? To what extent do we see this reflected in our students’ behaviors?
Changes in top occupations advertised regionally in 2018, 2019, and 2020
Top occupations
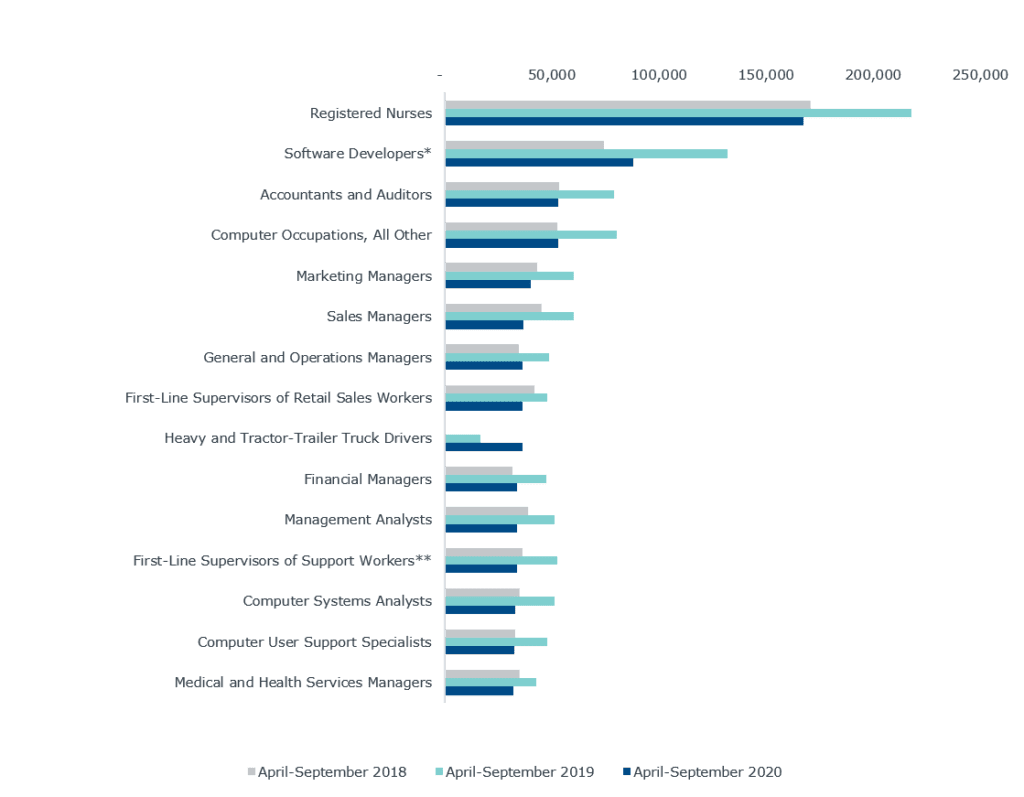
Top occupations for associate-level professionals
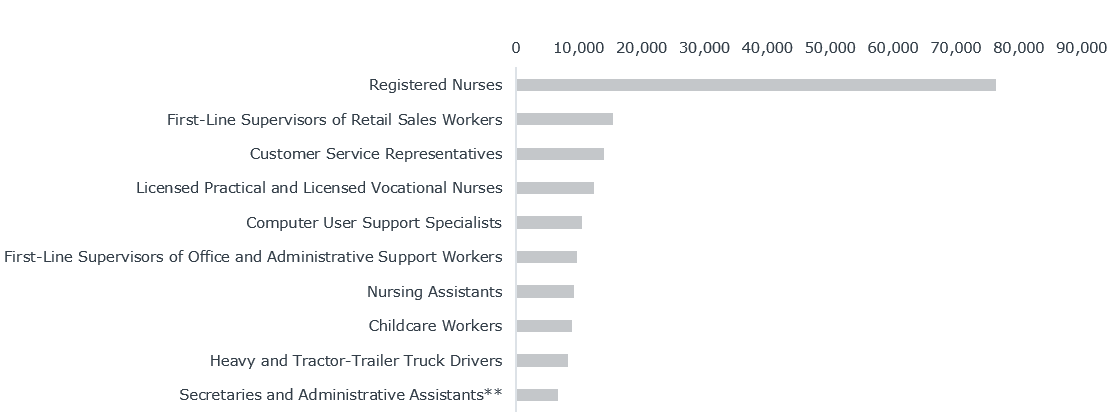
Top occupations for bachelor’s-level professionals
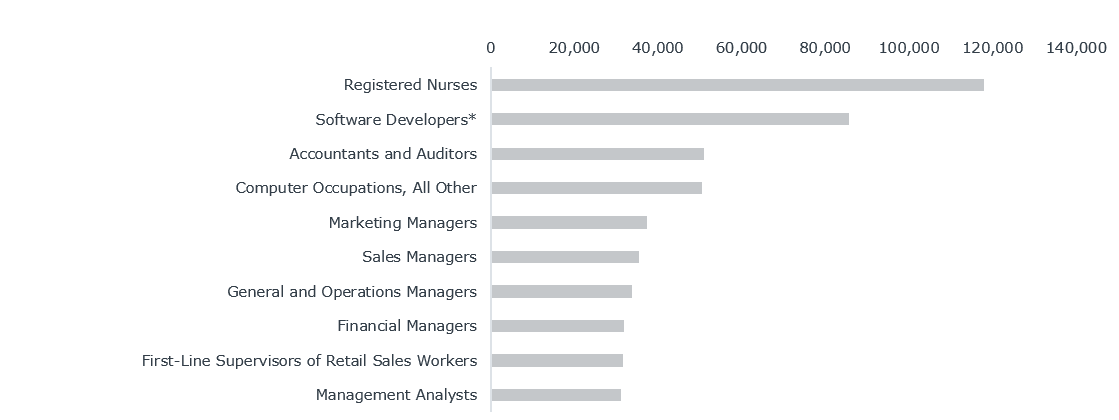
Top occupations for advanced degree professionals
Questions for initial discussion:
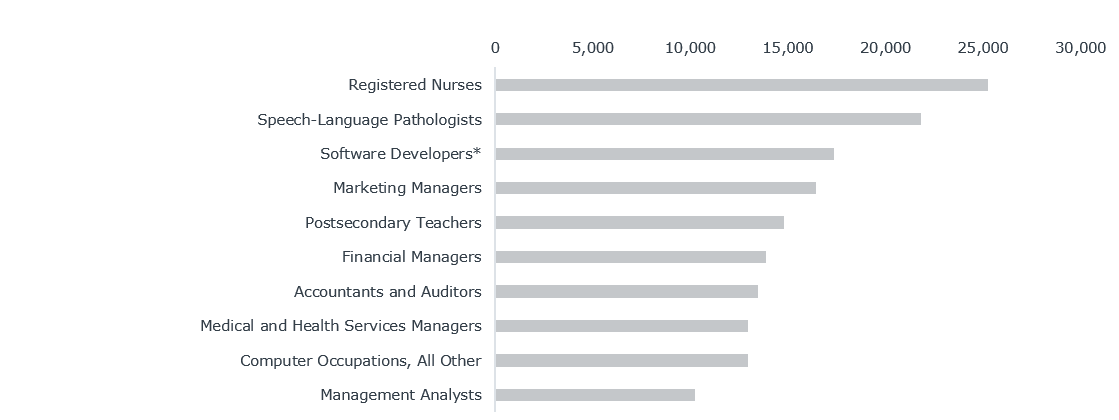
- Which roles, if any, experienced increased demand in 2020 relative to 2019 and 2018? To what extent would past trends encourage us to anticipate a sustained increase? Or, do we anticipate the increase was driven by the outbreak and may decline once short-term needs are met?
- Do we offer programs to prepare students for in-demand roles?
- Which roles experienced decreased demand in 2020 relative to 2019 and 2018? Would industry projections as we recover from the coronavirus outbreak suggest future growth or continued decline for these roles?
- Should we temper expectations for relevant program enrollment?
- Is it likely these roles also suffered layoffs across recent months? Do we likely have alumni or community members who need re-training for reemployment?
Top skills sought regionally after the U.S. coronavirus outbreak
Top skills sought
Questions for initial discussion:
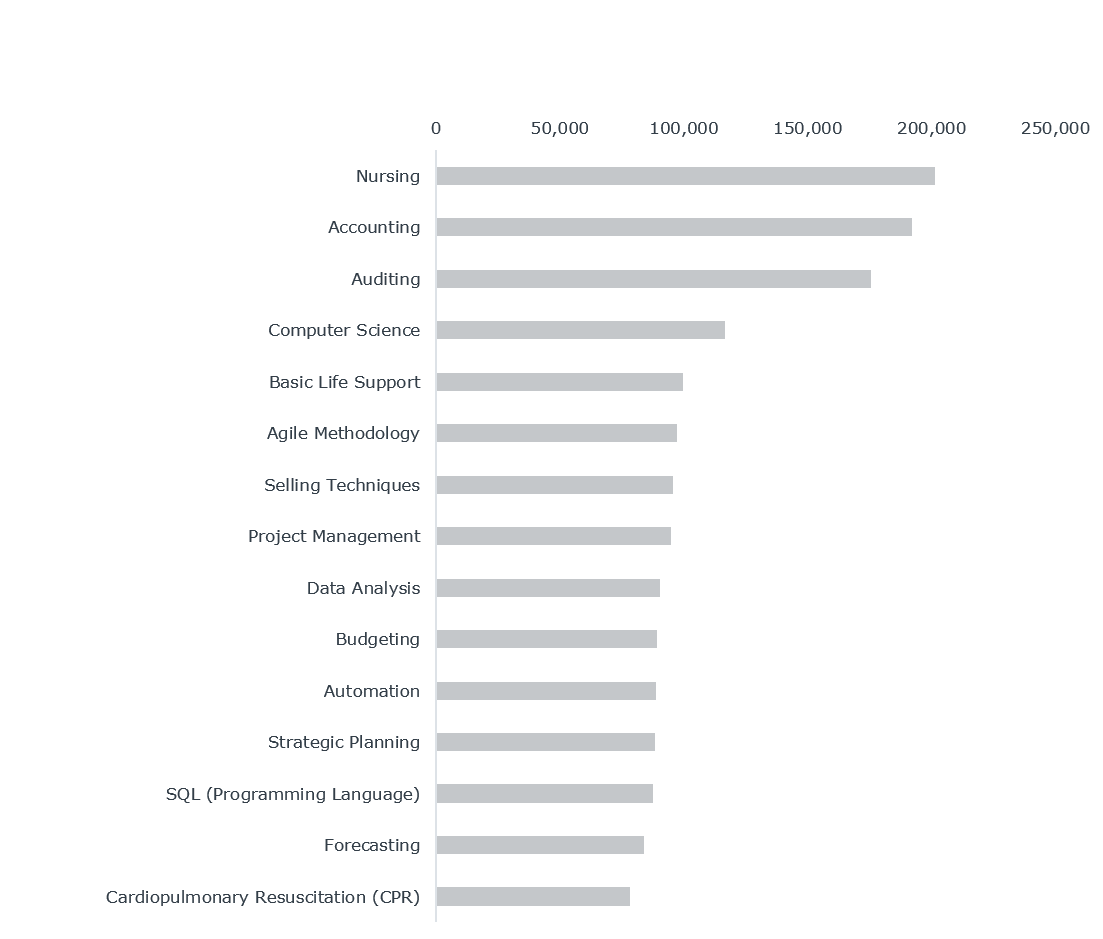
- Which skills are in greatest demand as the coronavirus outbreak continues? Do we expect these trends to hold?
- Are we teaching in-demand skills? Can prospective students easily identify which programs teach these skills? Do employers recognize which of our programs develop these in-demand skills?
Changes in skills sought regionally before and after the U.S. coronavirus outbreak
Fastest-growing skills, April-September 2020 relative to April-September 2019
South regional data, April-September 2020
| Skill | Number of Job Postings, April-Sept. 2019 | Proportion of All Job Postings April-Sept. 2019 | Number of Job Postings, April-Sept. 2020 | Proportion of All Job Postings April-Sept. 2020 | Percent Change |
| Acute Care | 50,525 | 1.68% | 38,173 | 1.80% | 5.59% |
| Triage | 19,940 | 0.66% | 17,827 | 0.84% | 5.40% |
| Human Services | 23,556 | 0.78% | 18,130 | 0.85% | 5.38% |
| Pharmaceuticals | 41,469 | 1.38% | 38,063 | 1.79% | 5.33% |
| Long-Term Care | 21,979 | 0.73% | 17,792 | 0.84% | 5.31% |
| Economics | 51,342 | 1.71% | 35,563 | 1.68% | 5.31% |
| Cash Handling | 23,284 | 0.77% | 17,655 | 0.83% | 5.29% |
| Good Manufacturing Practices | 19,258 | 0.64% | 17,633 | 0.83% | 5.25% |
| Profit And Loss (P&L) Management | 47,185 | 1.57% | 37,471 | 1.77% | 5.22% |
| Certified Information Systems Security Professional | 23,969 | 0.80% | 17,841 | 0.84% | 5.15% |
| Geriatrics | 23,708 | 0.79% | 18,068 | 0.85% | 5.11% |
| System Administration | 27,717 | 0.92% | 17,698 | 0.83% | 5.09% |
| Flatbed Truck Operation | N/A | N/A | 20,516 | 0.97% | 5.01% |
| Case Management | 51,290 | 1.70% | 37,480 | 1.77% | 5.01% |
| Business Model | 27,065 | 0.90% | 20,509 | 0.97% | 4.99% |
Questions for initial discussion:
- To what extent do we anticipate demand for these emerging skills to continue growing, or to sustain at these higher levels, in the future?
- Are we teaching emerging skills that experienced significant growth compared to demand earlier this year? If so, have we experienced increased interest/applications/enrollments in relevant programs? If not, how can we better communicate to prospective students that these offerings instill emerging skills?
Industries’ employer demand before and after the U.S. coronavirus outbreak
Job postings by industry, April-September 2020 relative to April-September 2019
South regional data, April-September 2020
| Industry | Number of Job Postings, April-Sept. 2019 | Proportion of All Job Postings, April-Sept. 2019 | Number of Job Postings, April-Sept. 2020 | Proportion of All Job Postings, April-Sept. 2020 | Percentage Point Change |
| Public Administration | 91,405 | 3.04% | 80,245 | 3.78% | 24.55% |
| Retail Trade | 192,894 | 6.41% | 145,570 | 6.86% | 7.06% |
| Information | 138,000 | 4.59% | 104,040 | 4.90% | 6.96% |
| Accommodation and Food Services | 76,048 | 2.53% | 45,968 | 2.17% | 1.34% |
| Health Care and Social Assistance | 413,612 | 13.74% | 286,501 | 13.51% | -1.73% |
| Transportation and Warehousing | 56,207 | 1.87% | 50,100 | 2.36% | -6.54% |
| Manufacturing | 266,010 | 8.84% | 174,328 | 8.22% | -7.03% |
| Construction | 64,354 | 2.14% | 40,708 | 1.92% | -7.14% |
| Utilities | 14,683 | 0.49% | 9,670 | 0.46% | -8.75% |
| Agriculture, Forestry, Fishing and Hunting | 5,283 | 0.18% | 3,393 | 0.16% | -8.88% |
| Administrative and Support and Waste Management and Remediation Services | 456,665 | 15.17% | 300,023 | 14.14% | -9.41% |
| Arts, Entertainment, and Recreation | 15,035 | 0.50% | 9,276 | 0.44% | -10.37% |
| Professional, Scientific, and Technical Services | 468,461 | 15.57% | 286,687 | 13.51% | -10.95% |
| Educational Services | 169,402 | 5.63% | 106,248 | 5.01% | -11.02% |
| Other Services (except Public Administration) | 51,064 | 1.70% | 34,843 | 1.64% | -12.05% |
| Wholesale Trade | 62,195 | 2.07% | 32,933 | 1.55% | -13.12% |
| Finance and Insurance | 249,954 | 8.31% | 151,905 | 7.16% | -13.78% |
| Real Estate and Rental and Leasing | 53,780 | 1.79% | 30,400 | 1.43% | -15.54% |
| Management of Companies and Enterprises | 12,303 | 0.41% | 6,307 | 0.30% | -27.27% |
| Mining, Quarrying, and Oil and Gas Extraction | 11,837 | 0.39% | 5,704 | 0.27% | -31.64% |
Questions for initial discussion:
- How did our local industry demand shift during the coronavirus outbreak?
- Which industries suffered the most, as demonstrated by the greatest decline in job postings?
- To what extent do we suspect alumni already employed in hard-hit fields may lose their employment and need re-training to secure available jobs?
Top hiring employers after the U.S. coronavirus outbreak
Top hiring employers
Questions for initial discussion:
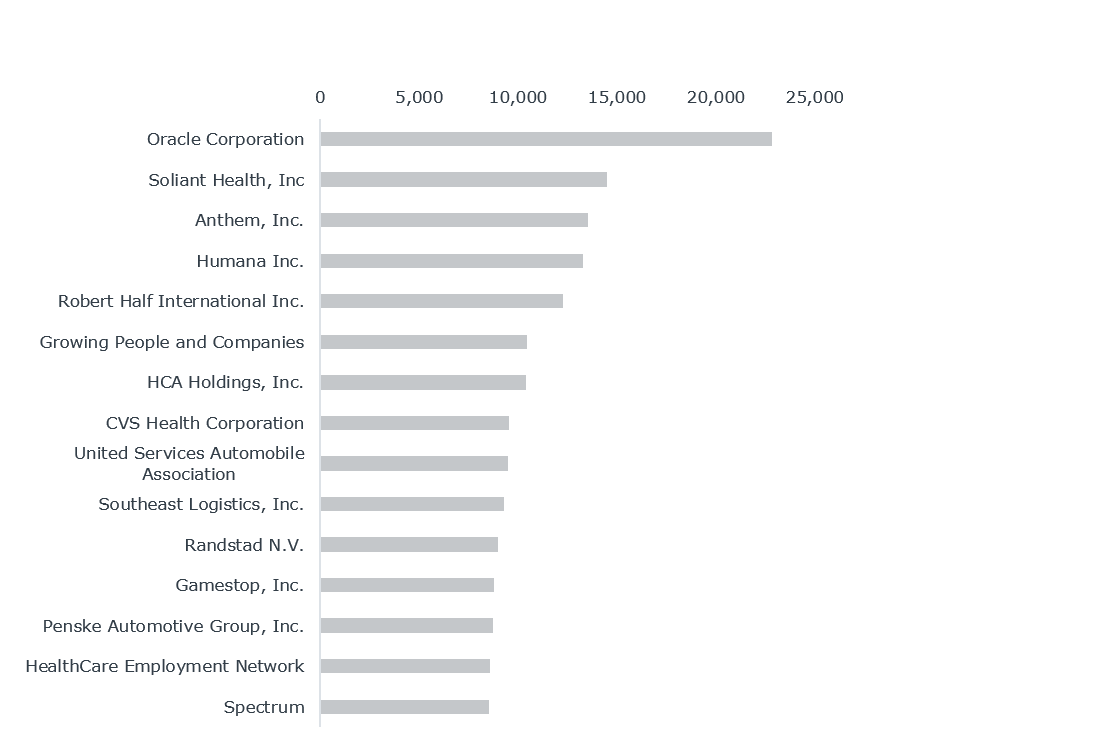
- Do we partner with any of these employers with the highest demand in recent months?
U.S. by region, Midwest
Changes in job postings volume
Questions for initial discussion:
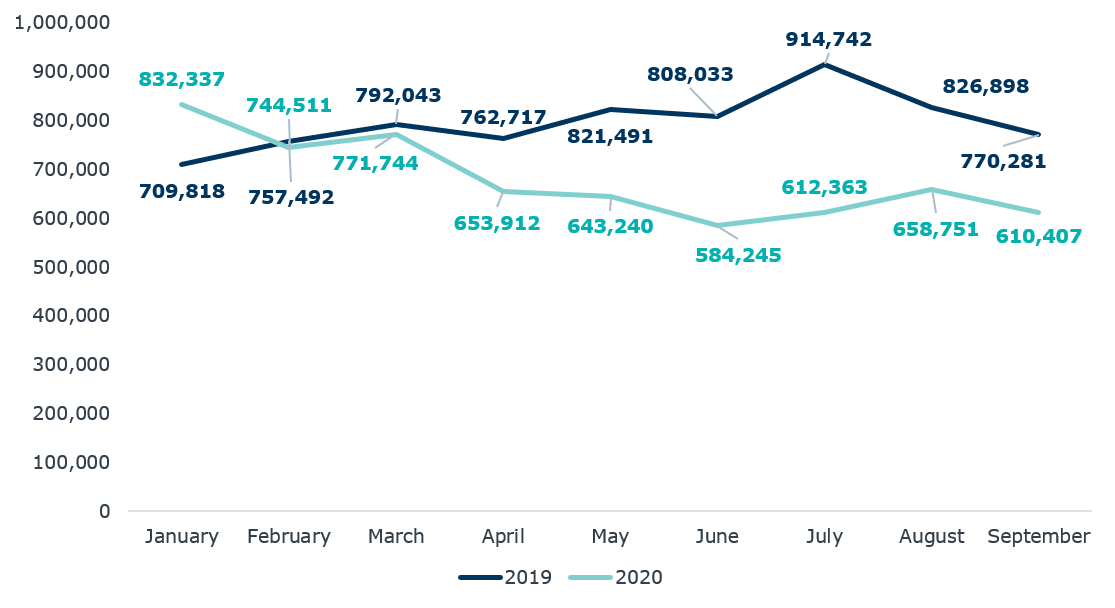
- How did our regional economy react to the coronavirus outbreak across April through September? Has our regional public health and economic response been consistent, or have we experienced improvements and declines throughout?
- How do our recent job posting trends contrast to this time last year? To what extent do we see this reflected in our students’ behaviors?
Changes in top occupations advertised regionally in 2018, 2019, and 2020
Top occupations
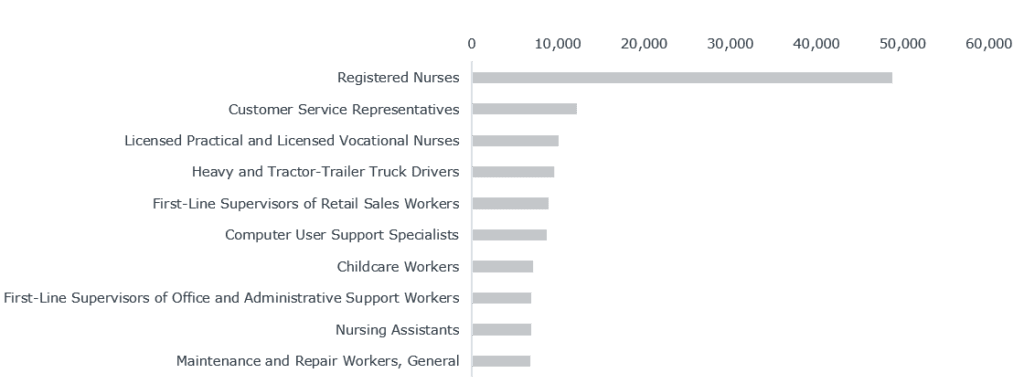
Top occupations for associate-level professionals
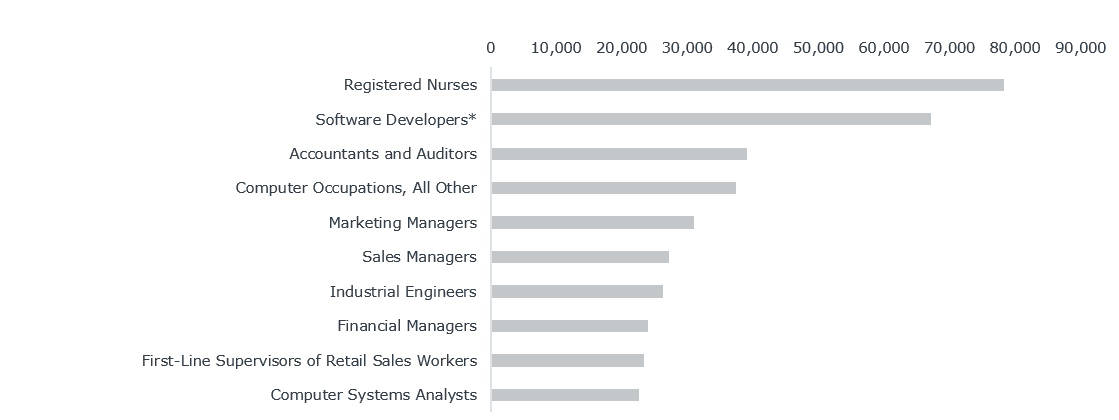
Top occupations for bachelor’s-level professionals
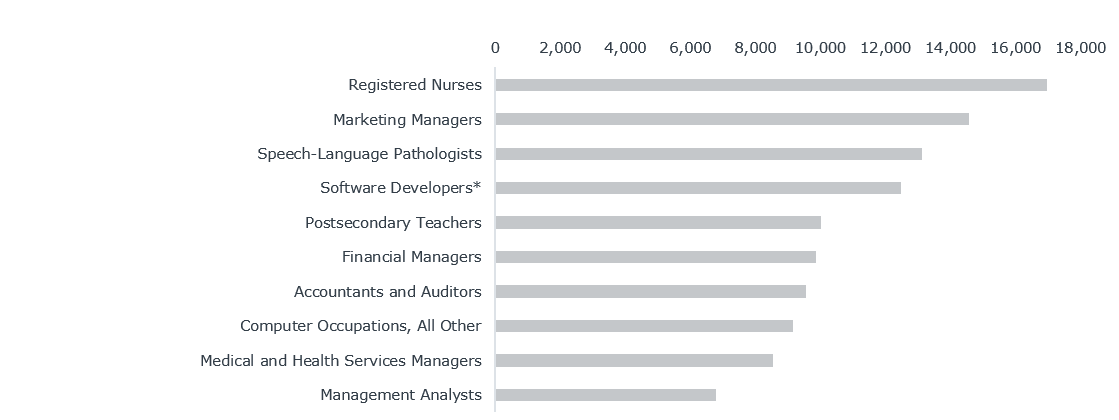
Top occupations for advanced degree professionals
Questions for initial discussion:
- Which roles, if any, experienced increased demand in 2020 relative to 2019 and 2018? To what extent would past trends encourage us to anticipate a sustained increase? Or, do we anticipate the increase was driven by the outbreak and may decline once short-term needs are met?
- Do we offer programs to prepare students for in-demand roles?
- Which roles experienced decreased demand in 2020 relative to 2019 and 2018? Would industry projections as we recover from the coronavirus outbreak suggest future growth or continued decline for these roles?
- Should we temper expectations for relevant program enrollment?
- Is it likely these roles also suffered layoffs across recent months? Do we likely have alumni or community members who need re-training for reemployment?
Top skills sought regionally after the U.S. coronavirus outbreak
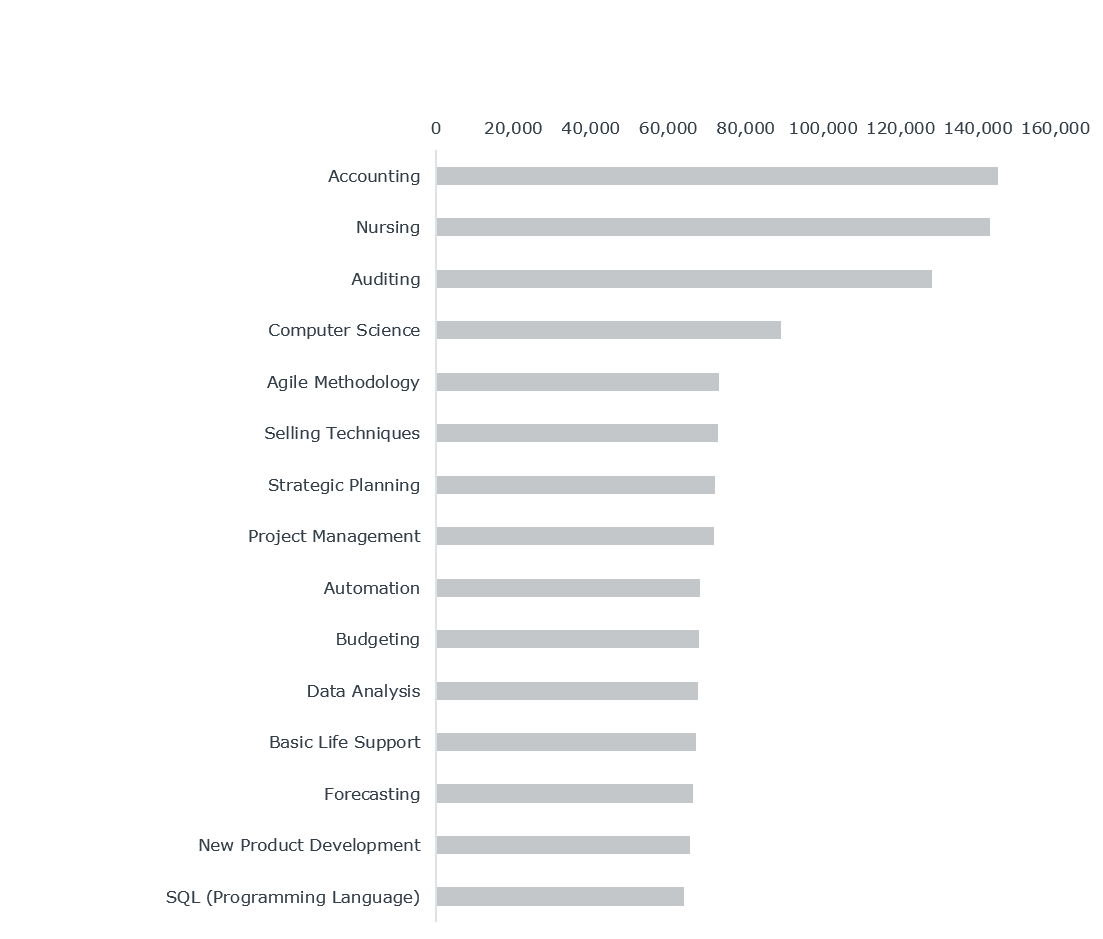
Top skills sought
Questions for initial discussion:
- Which skills are in greatest demand as the coronavirus outbreak continues? Do we expect these trends to hold?
- Are we teaching in-demand skills? Can prospective students easily identify which programs teach these skills? Do employers recognize which of our programs develop these in-demand skills?
Changes in skills sought regionally before and after the U.S. coronavirus outbreak
Fastest-growing skills, April-September 2020 relative to April-September 2019
Midwest regional data, April-September 2020
| Skill | Number of Job Postings, April-Sept. 2019 | Proportion of All Job Postings, April-Sept. 2019 | Number of Job Postings, April-Sept. 2020 | Proportion of All Job Postings April-Sept. 2020 | Percentage Point Growth | ||
| Java (Programming Language) | 73,491 | 3.19% | 45,924 | 2.86% | 10.49% | ||
| Master Of Business Administration (MBA) | 71,266 | 3.09% | 44,960 | 2.80% | 8.33% | ||
| Inventory Control | 20,455 | 0.89% | 15,506 | 0.97% | 8.00% | ||
| Oncology | 16,306 | 0.71% | 15,499 | 0.97% | 7.98% | ||
| Construction Management | 21,564 | 0.93% | 15,438 | 0.96% | 7.69% | ||
| Advanced Cardiovascular Life Support (ACLS) | 32,586 | 1.41% | 36,745 | 2.29% | 7.63% | ||
| Tableau (Business Intelligence Software) | 22,561 | 0.98% | 15,544 | 0.97% | 7.53% | ||
| Operating Systems | 51,299 | 2.22% | 36,424 | 2.27% | 7.50% | ||
| Business Model | 20,640 | 0.89% | 15,845 | 0.99% | 7.41% | ||
| Medical Devices | 23,287 | 1.01% | 15,612 | 0.97% | 7.39% | ||
| Nurse Practitioner | 16,568 | 0.72% | 15,718 | 0.98% | 7.27% | ||
| Marketing Strategies | 25,051 | 1.09% | 15,795 | 0.98% | 7.25% | ||
| Medicaid | 23,350 | 1.01% | 15,848 | 0.99% | 7.13% | ||
| Food Safety | 17,183 | 0.74% | 15,863 | 0.99% | 6.97% | ||
| Amazon Web Services | 34,942 | 1.51% | 36,165 | 2.25% | 6.89% |
Questions for initial discussion:
- To what extent do we anticipate demand for these emerging skills to continue growing, or to sustain at these higher levels, in the future?
- Are we teaching emerging skills that experienced significant growth compared to demand earlier this year? If so, have we experienced increased interest/applications/enrollments in relevant programs? If not, how can we better communicate to prospective students that these offerings instill emerging skills?
Industries’ employer demand before and after the U.S. coronavirus outbreak
Job postings by industry, April-September 2020 relative to April-September 2019
Midwest Regional Data, April-September 2020 Relative to April-September 2019
| Industry | Number of Job Postings, April-Sept. 2019 | Proportion of All Job Postings, April-Sept. 2019 | Number of Job Postings, April-Sept. 2020 | Proportion of All Job Postings, April-Sept. 2020 | Percentage Point Change |
| Public Administration | 51,449 | 2.23% | 53,069 | 3.31% | 29.37% |
| Utilities | 11,109 | 0.48% | 8,559 | 0.53% | 10.78% |
| Educational Services | 118,697 | 5.15% | 78,231 | 4.88% | 10.69% |
| Retail Trade | 144,297 | 6.26% | 108,829 | 6.78% | 8.45% |
| Management of Companies and Enterprises | 8,237 | 0.36% | 4,256 | 0.27% | 3.78% |
| Construction | 39,995 | 1.73% | 26,192 | 1.63% | -0.91% |
| Wholesale Trade | 58,984 | 2.56% | 35,013 | 2.18% | -2.56% |
| Health Care and Social Assistance | 308,814 | 13.39% | 222,916 | 13.90% | -3.41% |
| Transportation and Warehousing | 38,008 | 1.65% | 26,684 | 1.66% | -4.06 |
| Administrative and Support and Waste Management and Remediation Services | 359,730 | 15.60% | 239,692 | 14.94% | -4.19% |
| Information | 101,627 | 4.41% | 78,850 | 4.92% | -4.48% |
| Other Services (except Public Administration) | 46,789 | 2.03% | 30,424 | 1.90% | -6.50% |
| Professional, Scientific, and Technical Services | 331,834 | 14.39% | 200,586 | 12.50% | -6.60% |
| Accommodation and Food Services | 51,670 | 2.24% | 33,127 | 2.07% | -7.42% |
| Manufacturing | 278,636 | 12.08% | 172,615 | 10.76% | -10.92% |
| Mining, Quarrying, and Oil and Gas Extraction | 3,079 | 0.13% | 1,902 | 0.12% | -11.18% |
| Real Estate and Rental and Leasing | 32,688 | 1.42% | 19,265 | 1.20% | -15.26% |
| Arts, Entertainment, and Recreation | 10,089 | 0.44% | 5,762 | 0.36% | -17.88% |
| Finance and Insurance | 207,472 | 8.99% | 114,617 | 7.15% | -10.56% |
| Agriculture, Forestry, Fishing and Hunting | 5,897 | 0.26% | 4,418 | 0.28% | -22.88% |
Questions for initial discussion:
- How did our local industry demand shift during the coronavirus outbreak?
- Which industries suffered the most, as demonstrated by the greatest decline in job postings?
- To what extent do we suspect alumni already employed in hard-hit fields may lose their employment and need re-training to secure available jobs?
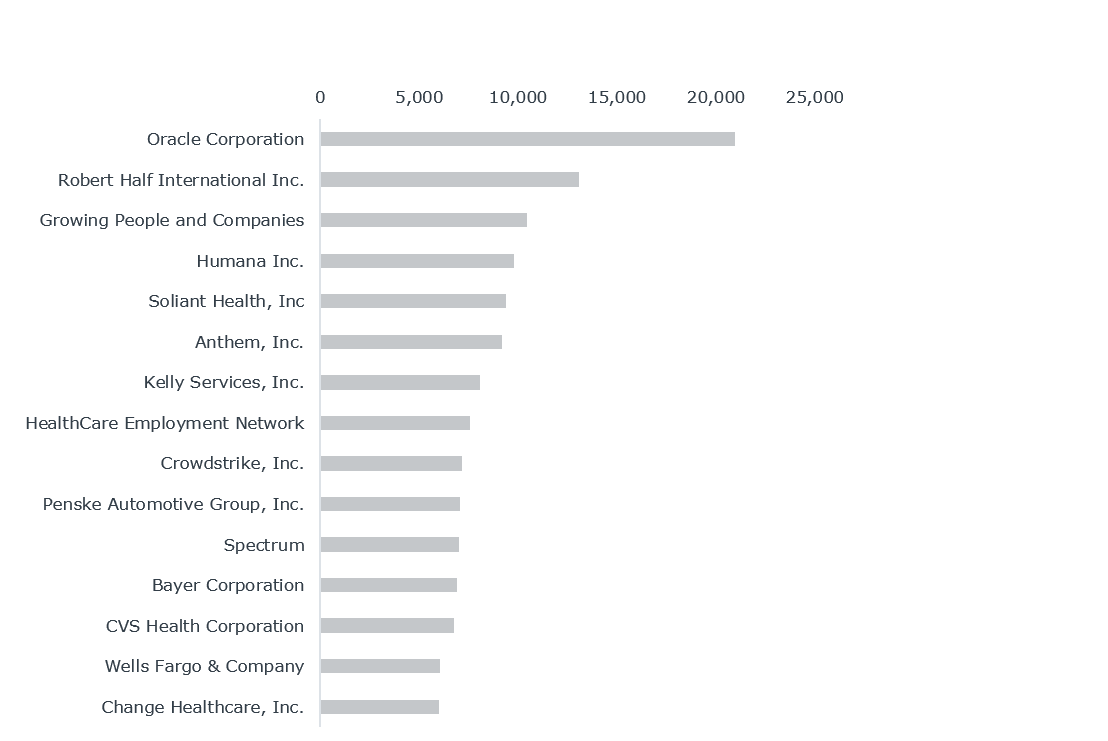
Top hiring employers after the U.S. coronavirus outbreak
Top hiring employers
Questions for initial discussion:
- Do we partner with any of these employers with the highest demand in recent months?
U.S. by region, Mountain West
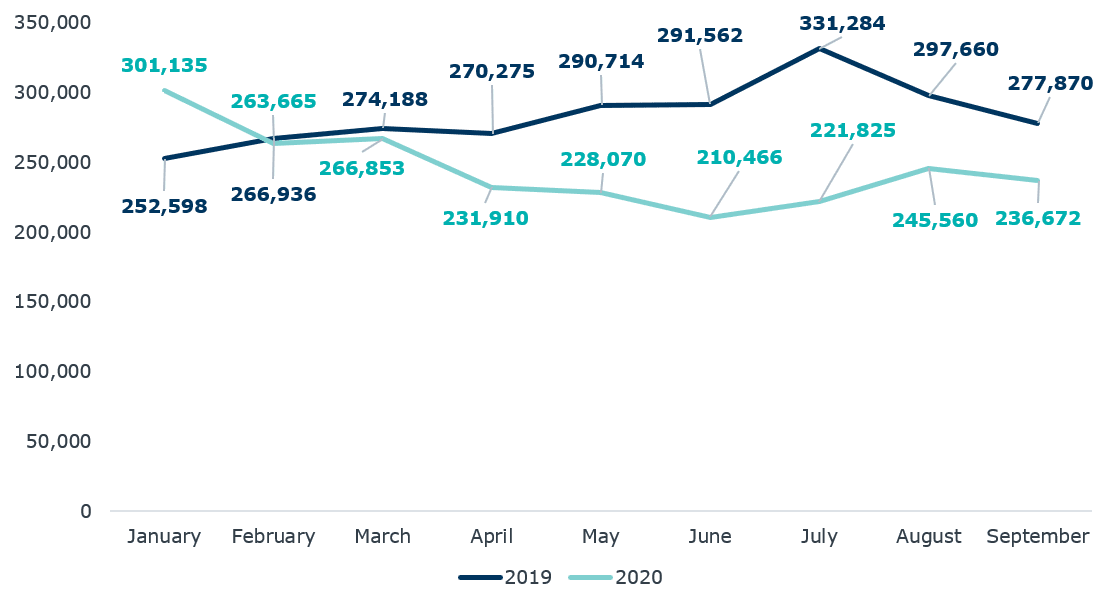
Changes in job postings volume
Questions for initial discussion:
- How did our regional economy react to the coronavirus outbreak across April through September? Has our regional public health and economic response been consistent, or have we experienced improvements and declines throughout?
- How do our recent job posting trends contrast to this time last year? To what extent do we see this reflected in our students’ behaviors?
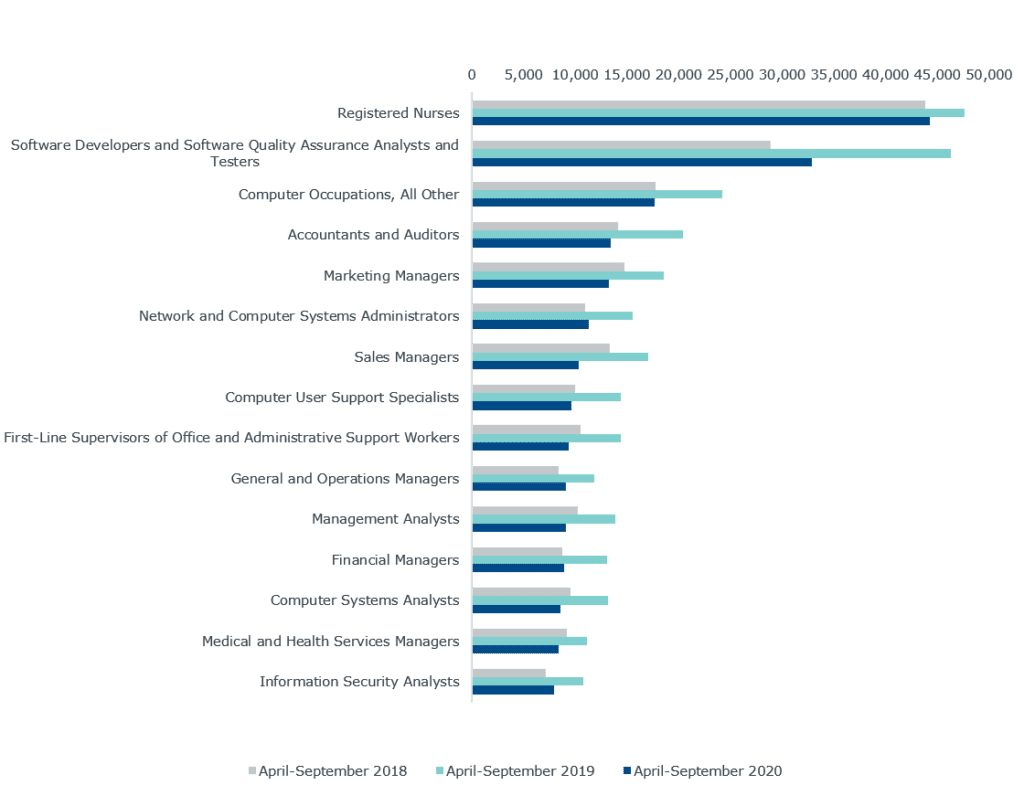
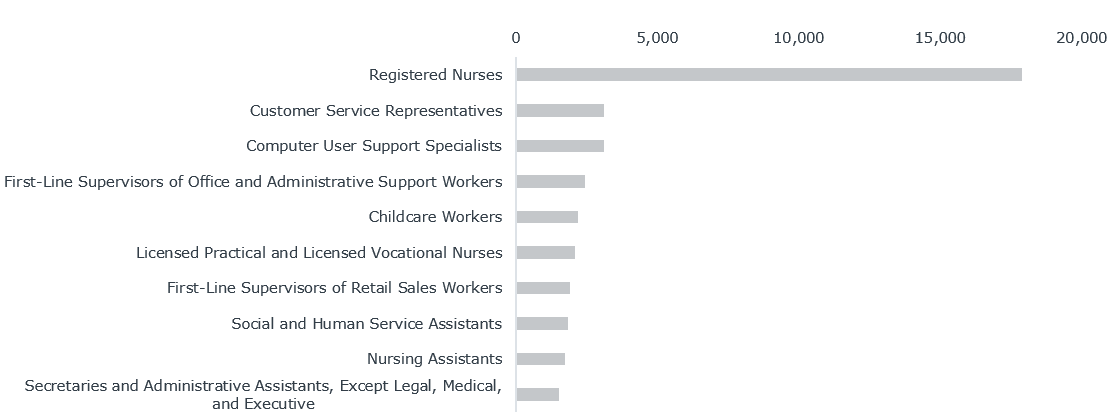
Changes in top occupations advertised regionally in 2018, 2019, and 2020
Top occupations
Top occupations for associate-level professionals
Top occupations for bachelor’s-level professionals
Top occupations for advanced degree professionals
Questions for initial discussion:
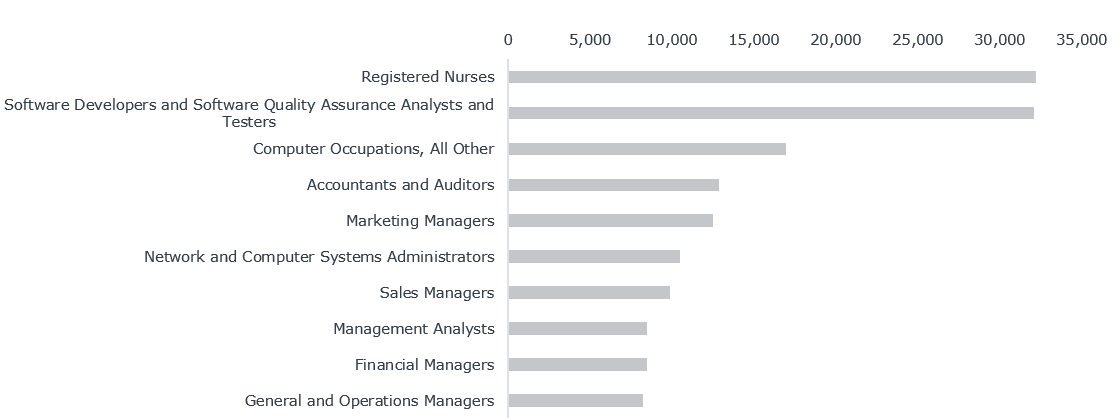
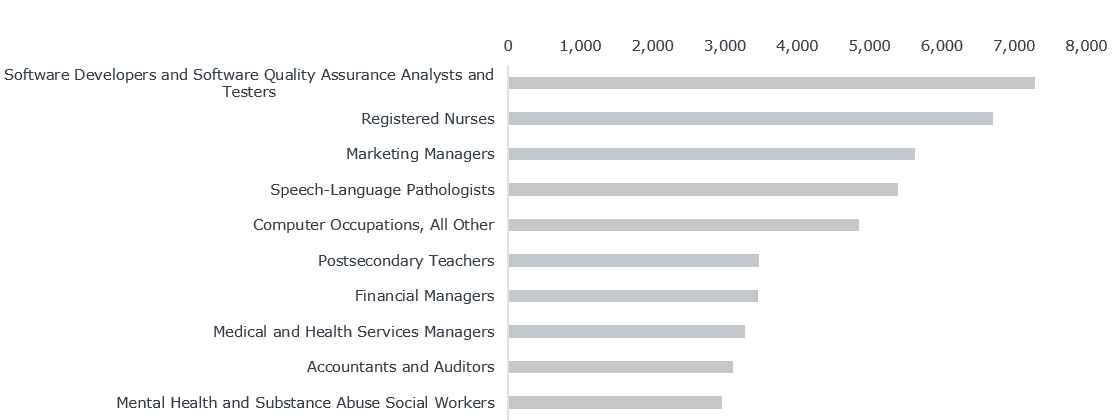
- Which roles, if any, experienced increased demand in 2020 relative to 2019 and 2018? To what extent would past trends encourage us to anticipate a sustained increase? Or, do we anticipate the increase was driven by the outbreak and may decline once short-term needs are met?
- Do we offer programs to prepare students for in-demand roles?
- Which roles experienced decreased demand in 2020 relative to 2019 and 2018? Would industry projections as we recover from the coronavirus outbreak suggest future growth or continued decline for these roles?
- Should we temper expectations for relevant program enrollment?
- Is it likely these roles also suffered layoffs immediately following the initial outbreak? Do we likely have alumni or community members who need re-training for reemployment?
Top skills sought regionally after the U.S. coronavirus outbreak
Top skills sought
Questions for initial discussion:
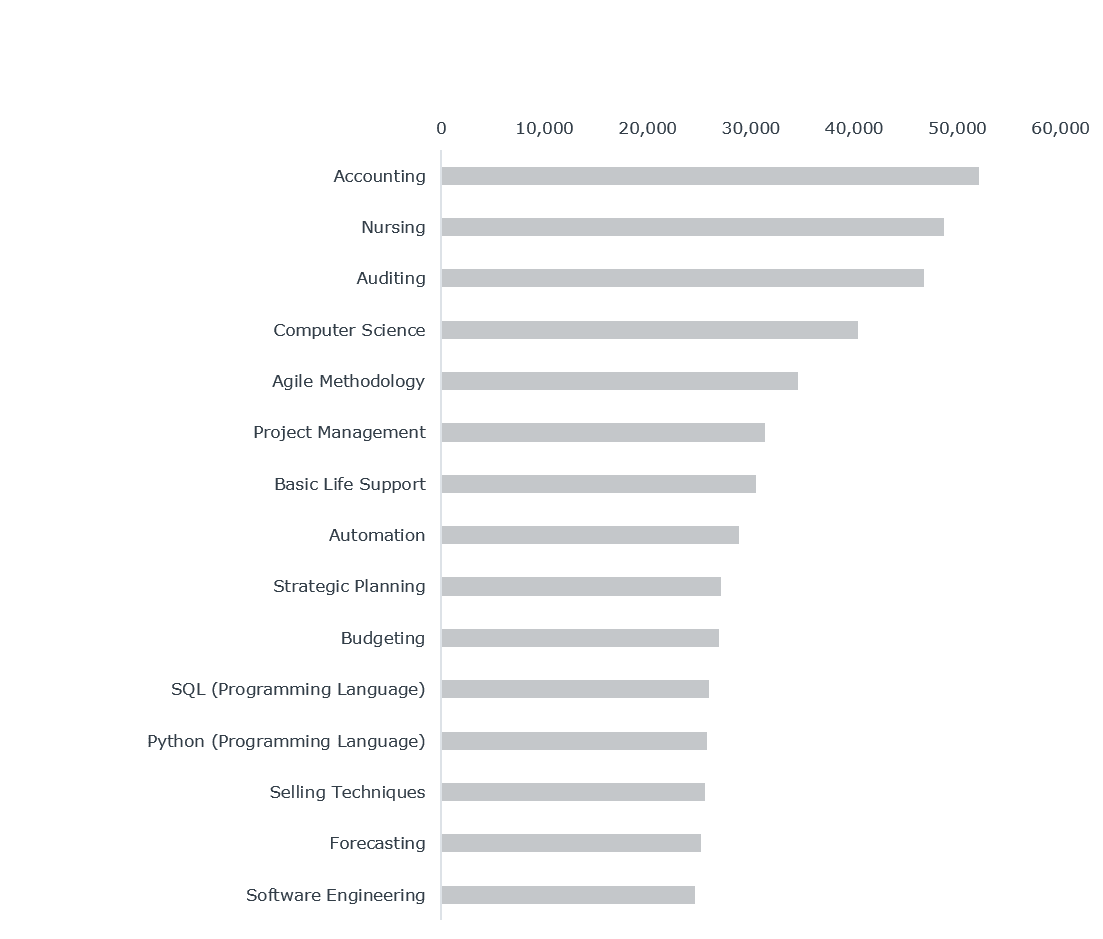
- Which skills are in greatest demand as the coronavirus outbreak continues? Do we expect these trends to hold?
- Are we teaching in-demand skills? Can prospective students easily identify which programs teach these skills? Do employers recognize which of our programs develop these in-demand skills?
Changes in skills sought regionally before and after the U.S. coronavirus outbreak
Fastest-growing skills, April-September 2020 relative to April-September 2019
Mountain West Regional Data, April-September 2020 Relative to April-September 2019
| Skill | Number of Job Postings, April-Sept. 2019 | Proportion of All Job Postings, April-Sept. 2019 | Number of Job Postings, April-Sept. 2020 | Proportion of All Job Postings, April-Sept. 2020 | Percent Change |
| Key Performance Indicators (KPIs) | 18,450 | 2/21% | 14,413 | 2.42% | 7.85% |
| JavaScript (Programming Language) | 24,898 | 2.99% | 14,385 | 2.42% | 7.70% |
| Instrumentation | 3,432 | 0.41% | 2,454 | 0.41% | 7.22% |
| Solution Selling | 3,695 | 0.44% | 2,484 | 0.42% | 7.10% |
| Networking Hardware | 3,430 | 0.41% | 2,456 | 0.41% | 7.08% |
| Wholesaling | 3,648 | 0.44% | 2,459 | 0.41% | 7.08% |
| Safety Training | 3,409 | 0.41% | 2,457 | 0.41% | 6.99% |
| Engineering Management | 3,528 | 0.42% | 2,831 | 0.48% | 6.97% |
| Loan Origination | N/A | N/A | 1,729 | 0.29% | 6.96% |
| Forestry | N/A | N/A | 2,464 | 0.41% | 6.93% |
| Mobile Application Development | 4,063 | 0.49% | 2,839 | 0.48% | 6.93% |
| Policy Development | 3,558 | 0.43% | 2,822 | 0.47% | 6.92% |
| Labour Laws | 3,904 | 0.47% | 2,838 | 0.48% | 6.92% |
| Higher Education | 4,180 | 0.50% | 2,800 | 0.47% | 6.90 |
| Performance Tuning | 4,239 | 0.51% | 2,883 | 0.48% | 6.89% |
Questions for initial discussion:
- To what extent do we anticipate demand for these emerging skills to continue growing, or to sustain at these higher levels, in the future?
- Are we teaching emerging skills that experienced significant growth compared to demand earlier this year? If so, have we experienced increased interest/applications/enrollments in relevant programs? If not, how can we better communicate to prospective students that these offerings instill emerging skills?
Industries’ employer demand before and after the U.S. coronavirus outbreak
Job postings by industry, April-September 2020 relative to April-September 2019
Mountain West Regional Data, April-September 2020 Relative to April-September 2019
| Industry | Number of Job Postings, January-April-Sept. 2019 | Proportion of All Job Postings, April-Sept. 2019 | Number of Job Postings, April-Sept. 2020 | Proportion of All Job Postings, April-Sept. 2020 | Percentage Point Change |
| Public Administration | 26,764 | 3.21% | 26,560 | 4.46% | 38.93% |
| Utilities | 4,051 | 0.49% | 3,184 | 0.53% | 10.03% |
| Retail Trade | 43,582 | 5.23% | 33,522 | 5.63% | 7.68% |
| Health Care and Social Assistance | 99,462 | 11.93% | 72,597 | 12.19% | 2.28% |
| Information | 63,282 | 7.59% | 47,963 | 8.05% | -0.08% |
| Manufacturing | 76,805 | 9.21% | 52,084 | 8.74% | -5.06% |
| Other Services (except Public Administration) | 15,545 | 1.86% | 10,211 | 1.71% | -8.04% |
| Construction | 18,747 | 2.25% | 12,077 | 2.03% | -9.81% |
| Finance and Insurance | 67,200 | 8.06% | 40,545 | 6.81% | -10.30% |
| Arts, Entertainment, and Recreation | 5,460 | 0.65% | 3,469 | 0.58% | -11.05% |
| Professional, Scientific, and Technical Services | 133,794 | 16.05% | 79,035 | 13.27% | -11.17% |
| Administrative and Support and Waste Management and Remediation Services | 124,561 | 14.94% | 84,589 | 14.20% | -11.49% |
| Educational Services | 53,542 | 6.42% | 33,657 | 5.65% | -12.00% |
| Transportation and Warehousing | 9,053 | 1.09% | 5,638 | 0.95% | -12.81% |
| Real Estate and Rental and Leasing | 14,621 | 1.75% | 9,348 | 1.57% | -14.89% |
| Wholesale Trade | 15,376 | 1.84% | 8,650 | 1.45% | -17.18% |
| Agriculture, Forestry, Fishing and Hunting | 2,460 | 0.30% | 1,424 | 0.24% | -18.96% |
| Mining, Quarrying, and Oil and Gas Extraction | 3,482 | 0.42% | 1,615 | 0.27% | -22.49% |
| Accommodation and Food Services | 23,579 | 2.83% | 12,246 | 2.06% | -27.29% |
| Management of Companies and Enterprises | 2,917 | 0.35% | 1,624 | 0.27% | -34.71% |
Questions for initial discussion:
- How did our local industry demand shift during the coronavirus outbreak?
- Which industries suffered the most, as demonstrated by the greatest decline in job postings?
- To what extent do we suspect alumni already employed in hard-hit fields may lose their employment and need re-training to secure available jobs?
Top hiring employers after the U.S. coronavirus outbreak
Top hiring employers
Questions for initial discussion:
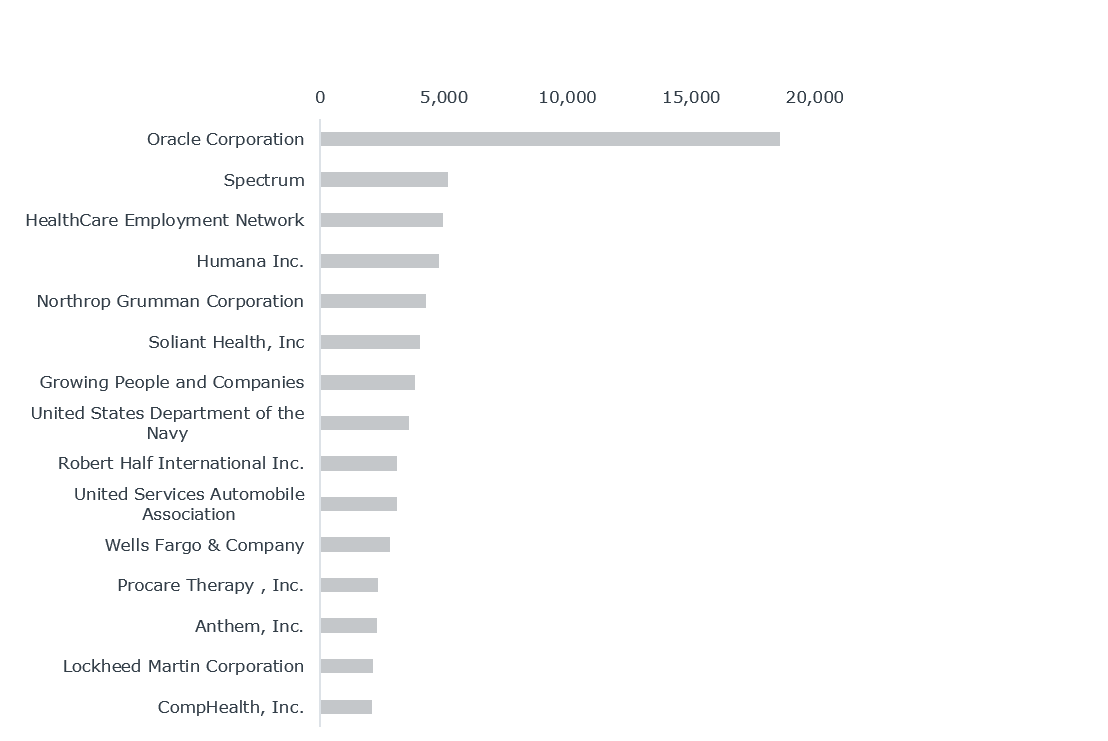
- Do we partner with any of these employers with the highest demand in recent months?
U.S. by region, Pacific West
Changes in job postings volume
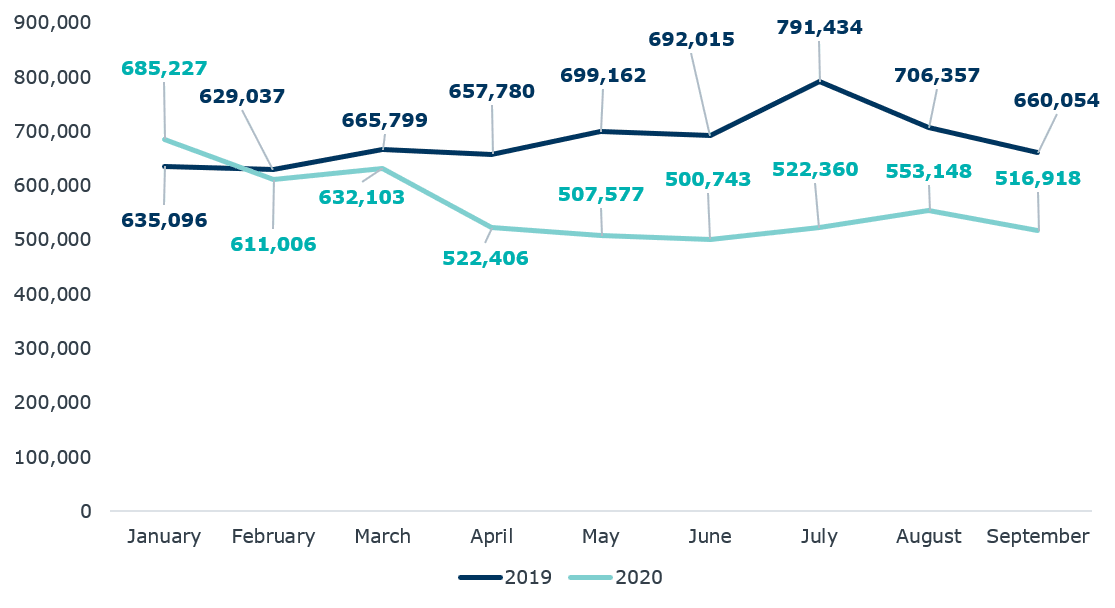
Questions for initial discussion:
- How did our regional economy react to the coronavirus outbreak across April through September? Has our regional public health and economic response been consistent, or have we experienced improvements and declines throughout?
- How do our recent job posting trends contrast to this time last year? To what extent do we see this reflected in our students’ behaviors?
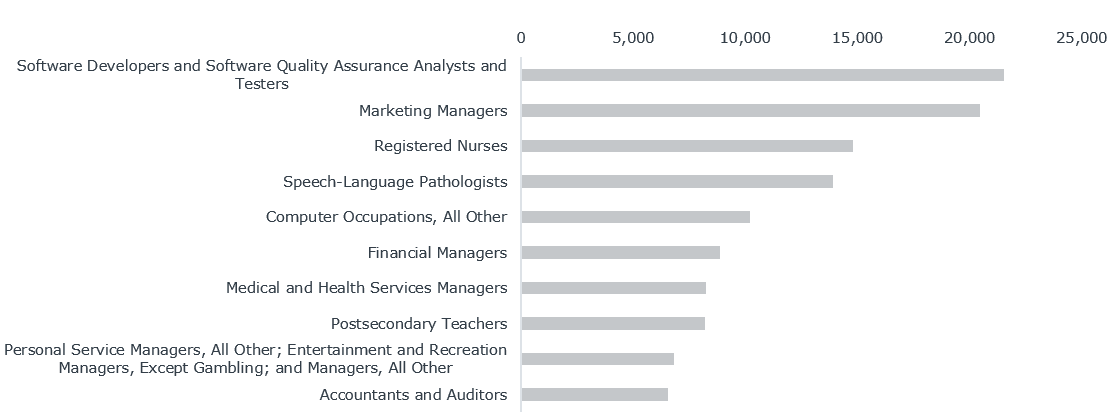
Changes in top occupations advertised regionally in 2018, 2019, and 2020
Top occupations
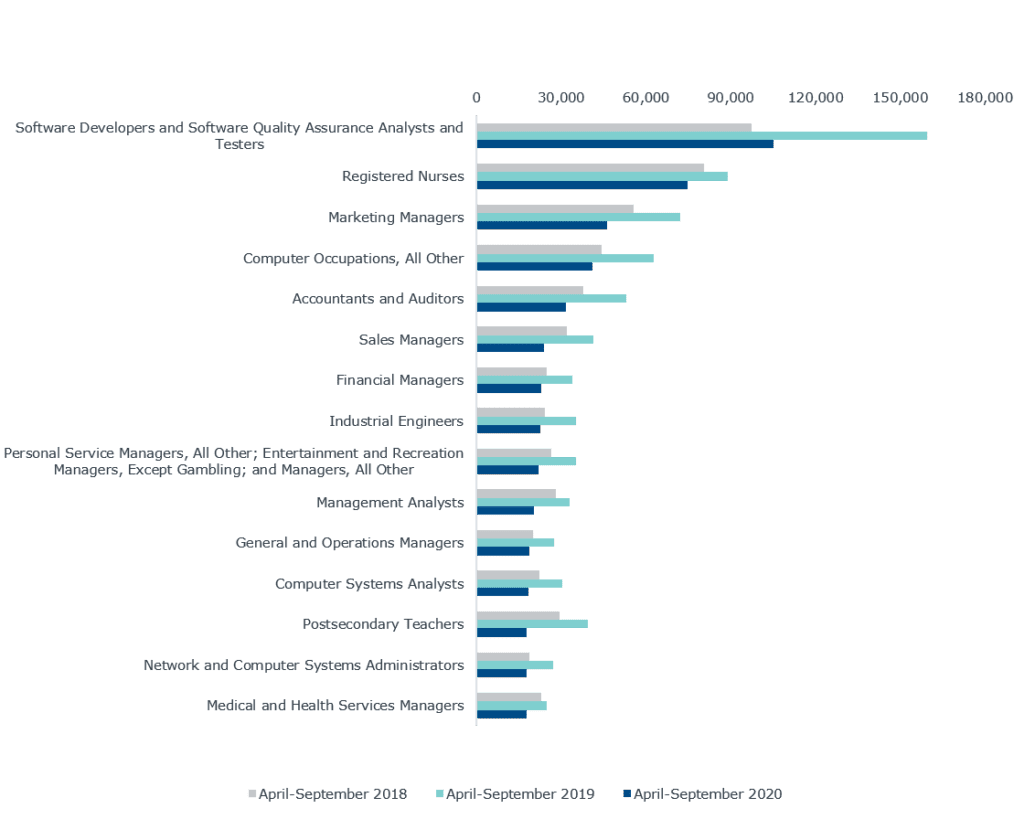
Top occupations for associate-level professionals
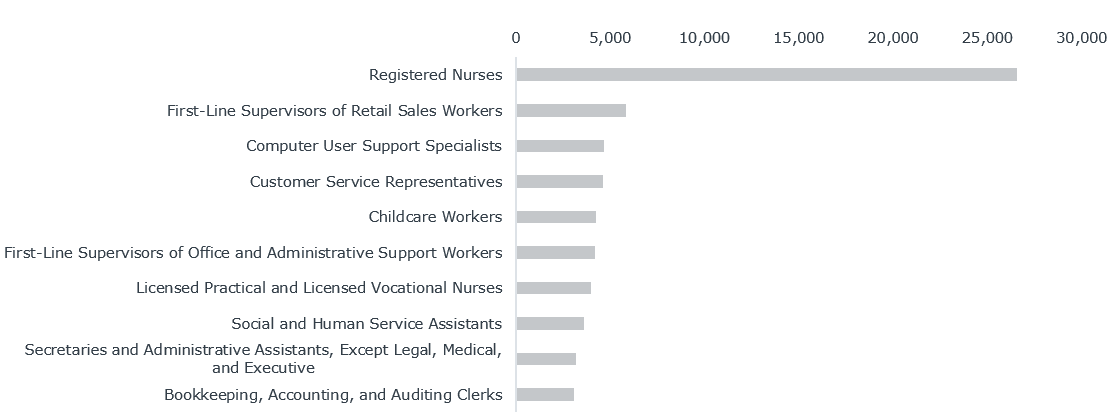
Top occupations for bachelor’s-level professionals
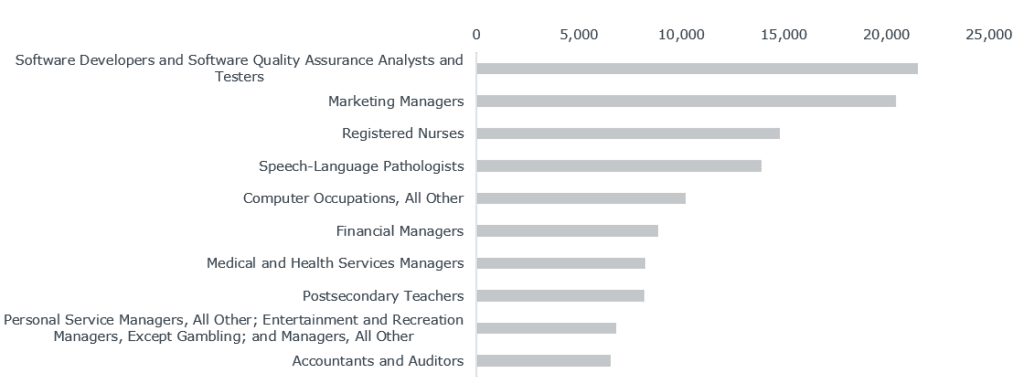
Top occupations for advanced degree professionals
Questions for initial discussion:
- Which roles, if any, experienced increased demand in 2020 relative to 2019 and 2018? To what extent would past trends encourage us to anticipate a sustained increase? Or, do we anticipate the increase was driven by the outbreak and may decline once short-term needs are met?
- Do we offer programs to prepare students for in-demand roles?
- Which roles experienced decreased demand in 2020 relative to 2019 and 2018? Would industry projections as we recover from the coronavirus outbreak suggest future growth or continued decline for these roles?
- Should we temper expectations for relevant program enrollment?
- Is it likely these roles also suffered layoffs immediately following the initial outbreak? Do we likely have alumni or community members who need re-training for reemployment?
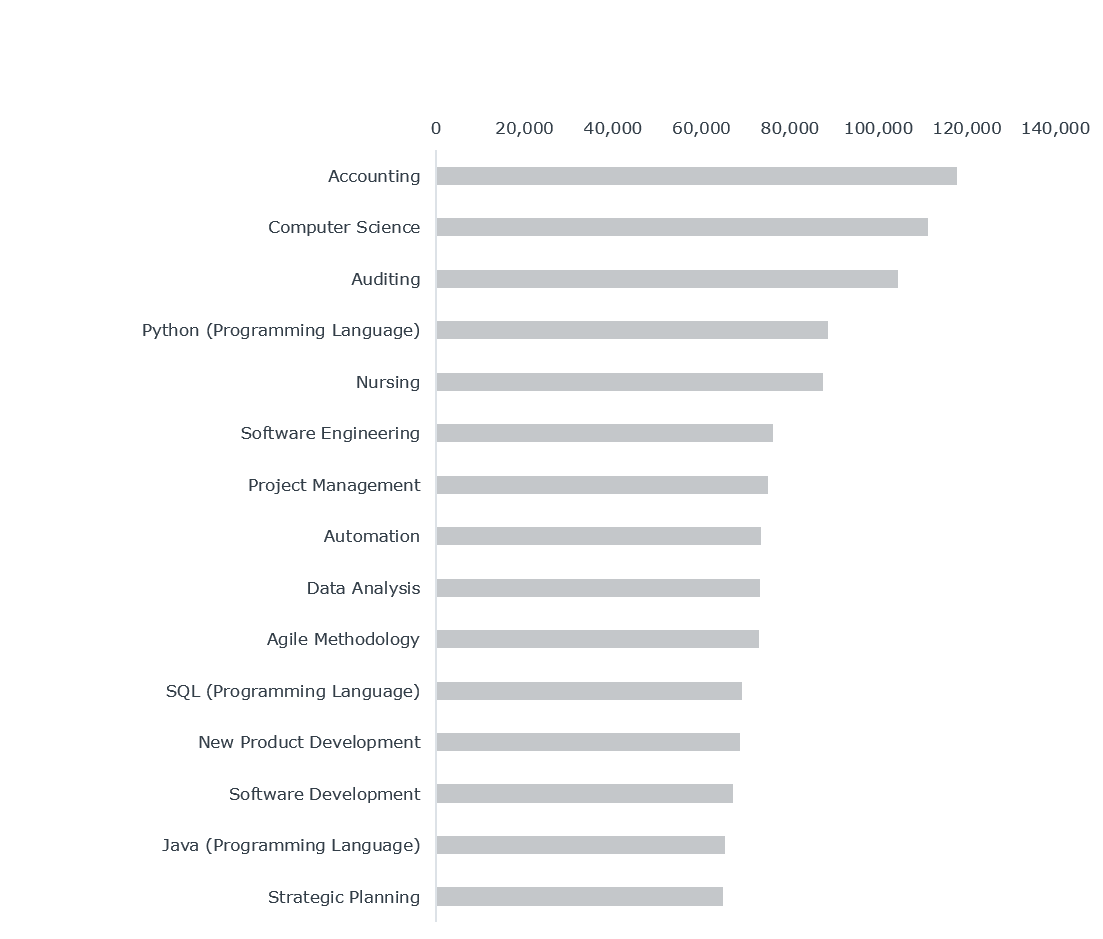
Top skills sought regionally after the U.S. coronavirus outbreak
Top skills sought
Questions for initial discussion:
- Which skills are in greatest demand as the coronavirus outbreak continues? Do we expect these trends to hold?
- Are we teaching in-demand skills? Can prospective students easily identify which programs teach these skills? Do employers recognize which of our programs develop these in-demand skills?
Changes in skills sought regionally before and after the U.S. coronavirus outbreak
Fastest-growing skills, April-September 2020 relative to April-September 2019
Pacific West Regional Data, April-September 2020 Relative to April-September 2019
| Skill | Number of Job Postings, April-Sept. 2019 | Proportion of All Job Postings, April-Sept. 2019 | Number of Job Postings, April-Sept. 2020 | Proportion of All Job Postings, April-Sept. 2020 | Percent Change |
| SolidWorks (CAD) | 9,749 | 0.50% | 6,056 | 0.47% | 8.82% |
| Field Service Management | 8,277 | 0.42% | 6,060 | 0.47% | 8.81% |
| Resource Allocation | 8,551 | 0.44% | 6,066 | 0.47% | 8.79% |
| Swift (Programming Language) | 7,160 | 0.37% | 6,067 | 0.47% | 8.73% |
| Sales Training | 11,500 | 0.59% | 6,046 | 0.47% | 8.70% |
| Calculations | 8,788 | 0.45% | 6,043 | 0.47% | 8.68% |
| Employee Benefits | 8,344 | 0.43% | 6,068 | 0.47% | 8.63% |
| Business Development | 82,989 | 4.24% | 52,031 | 4.03% | 8.55% |
| Radiology | 7,200 | 0.37% | 6,031 | 0.47% | 8.53% |
| Puppet (Configuration Management Tool) | 9,842 | 0.50% | 6,370 | 0.49% | 8.44% |
| Cell Cultures | 6,298 | 0.32% | 6,074 | 0.47% | 8.24% |
| Chemical Engineering | 7,499 | 0.38% | 6,100 | 0.47% | 8.22% |
| Product Quality (QA/QC) | 9,174 | 0.47% | 6,345 | 0.49% | 8.21% |
| Objective-C (Programming Language) | 7,933 | 0.41% | 6,107 | 0.47% | 8.15% |
| Constructive Feedback | 8,262 | 0.42% | 6,371 | 0.49% | 8.11% |
Questions for initial discussion:
- To what extent do we anticipate demand for these emerging skills to continue growing, or to sustain at these higher levels, in the future?
- Are we teaching emerging skills that experienced significant growth compared to demand earlier this year? If so, have we experienced increased interest/applications/enrollments in relevant programs? If not, how can we better communicate to prospective students that these offerings instill emerging skills?
Industries’ employer demand before and after the U.S. coronavirus outbreak
Job postings by industry, April-September 2020 relative to April-September 2019
Pacific West Regional Data, April-September 2020 Relative to April-September 2019
| Industry | Number of Job Postings, April-Sept. 2019 | Proportion of All Job Postings, April-Sept. 2019 | Number of Job Postings, April-Sept. 2020 | Proportion of All Job Postings, April-Sept. 2020 | Percentage Point Increase |
| Public Administration | 49,758 | 2.54% | 41,200 | 3.19% | 25.39% |
| Utilities | 7,795 | 0.40% | 7,951 | 0.62% | 9.54% |
| Retail Trade | 131,134 | 6.70% | 95,556 | 7.39% | 6.18% |
| Health Care and Social Assistance | 206,816 | 10.57% | 142,990 | 11.06% | 4.70% |
| Arts, Entertainment, and Recreation | 10,992 | 0.56% | 5,758 | 0.45% | 2.05% |
| Manufacturing | 227, 373 | 11.62% | 150,896 | 11.67% | 0.50% |
| Information | 148,578 | 7.59% | 98,230 | 7.60% | 0.12% |
| Other Services (except Public Administration) | 36,746 | 1.88% | 25,428 | 1.97% | -1.56% |
| Construction | 35,580 | 1.82% | 22,237 | 1.72% | -8.36% |
| Professional, Scientific, and Technical Services | 322,320 | 16.47% | 184,724 | 14.29% | -8.90% |
| Transportation and Warehousing | 19,163 | 0.98% | 11,469 | 0.89% | -9.37% |
| Administrative and Support and Waste Management and Remediation Services | 307,069 | 15.69% | 187,557 | 14.51% | -11.88% |
| Real Estate and Rental and Leasing | 28,897 | 1.48% | 16,705 | 1.29% | -12.46% |
| Finance and Insurance | 136,274 | 6.96% | 65,880 | 5.10% | -13.32% |
| Wholesale Trade | 31,513 | 1.61% | 17,822 | 1.38% | -14.36% |
| Management of Companies and Enterprises | 5,304 | 0.27% | 2,951 | 0.23% | -15.75% |
| Accommodation and Food Services | 39,118 | 2.00% | 19,645 | 1.52% | -16.39% |
| Mining, Quarrying, and Oil and Gas Extraction | 2,262 | 0.12% | 1,220 | 0.09% | -18.33% |
| Educational Services | 115,096 | 5.88% | 66,329 | 5.13% | -23.30% |
| Agriculture, Forestry, Fishing and Hunting | 8,544 | 0.44% | 3,412 | 0.26% | -33.72% |
Questions for initial discussion:
- How did our local industry demand shift during the coronavirus outbreak?
- Which industries suffered the most, as demonstrated by the greatest decline in job postings?
- To what extent do we suspect alumni already employed in hard-hit fields may lose their employment and need re-training to secure available jobs?
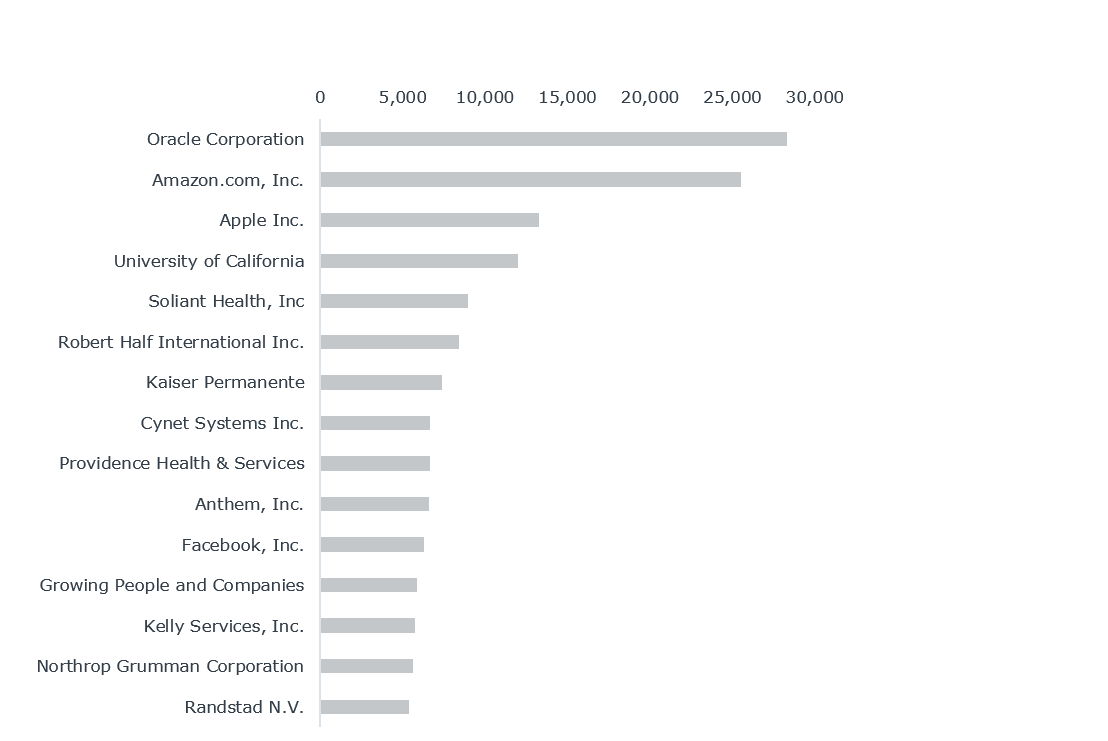
Top hiring employers after the U.S. coronavirus outbreak
Top hiring employers
Questions for initial discussion:
- Do we partner with any of these employers with the highest demand in recent months?
Design credentials to meet adult student needs
Design student-centric credentials, versus credential-centric, to ensure the offering matches the audience’s needs.
This resource requires EAB partnership access to view.
Access the tool
Learn how you can get access to this resource as well as hands-on support from our experts through Professional and Adult Education Advisory Services.
Learn More