Resources
Featured Resources

Insight Paper
College Search Trends Across Space and Time
This insight paper delves into college search trends in the application process among first-time undergraduates at four-year institutions.
Enroll360
Infographic
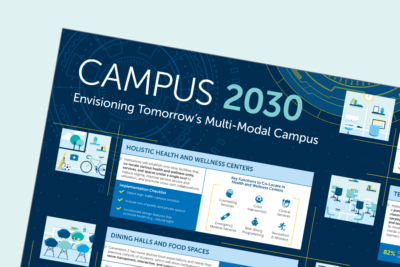
Campus 2030: Envisioning tomorrow’s multi-modal campus
Explore our infographic to learn about the future of the multi-modal campus and how seven spaces will change…
Strategic Advisory Services

Research Report
The Rise of the Chief Wellness Officer
Chief Wellness Officer (CWO) positions have grown rapidly across the past few years due to growth in appreciation…
Strategic Advisory Services
Recent Blog Posts
More Blog Posts
Blog Post
Why graduate enrollment leaders should measure revenue, not just headcount
Adult Education Blog
Blog Post
Why higher ed administrative transformation stalls at scale
Higher Education Strategy Blog
Blog Post
Three ways fraudulent applications may be undermining your graduate enrollment strategy
Adult Education BlogLatest Podcast Episode
More Episodes
Podcast
Why SEO Isn't Enough in the Age of AI
As students increasingly rely on AI tools like ChatGPT to research colleges, experts explain what university marketers must…
Podcast
How the University of Minnesota Reimagined Its Future
Learn how the University of Minnesota planned and executed a comprehensive strategic review, and the lessons other university…
Podcast
Can K-12 and Higher Ed Bridge the Student Readiness Gap?
Experts discuss the escalating student readiness crisis, exploring how leaders across both higher ed and K-12 institutions can…
Latest Partner Resource

Insight Paper
Dynamic Strategy Research Briefing
A briefing for higher education leaders on embedding rigour, agility, and accountability into strategic planning
Professional and Academic Services Forum